|
This past week showed a sharp turnaround in equities, rebounding from the prior week’s losses. Dovish reports and comments from the Fed helped. Economic data generally have beat expectations and earnings for the first quarter were mostly favorable as released this past week.
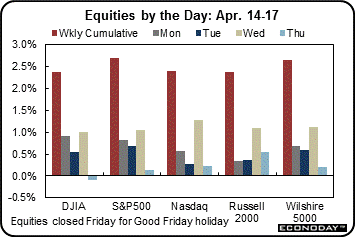 Major indexes generally posted gains of over 2 percent in the holiday abbreviated week. Stocks got a boost right out of the gate Monday after stronger-than-expected retail sales. Also, earnings from Citigroup added lift. Even though the Empire State manufacturing survey disappointed, earnings from Coca-Cola and Johnson & Johnson helped boost stocks for the day. Major indexes generally posted gains of over 2 percent in the holiday abbreviated week. Stocks got a boost right out of the gate Monday after stronger-than-expected retail sales. Also, earnings from Citigroup added lift. Even though the Empire State manufacturing survey disappointed, earnings from Coca-Cola and Johnson & Johnson helped boost stocks for the day.
 Stocks gained further Wednesday on dovish comments from Fed Chair Janet Yellen. Also, China's gross domestic product grew 7.4 percent in the first quarter, the slowest rate in 18 months, but above forecasts of 7.3 percent. Traders said the slowing pace of growth raised some hopes of more stimulus from the Chinese government. Stocks gained further Wednesday on dovish comments from Fed Chair Janet Yellen. Also, China's gross domestic product grew 7.4 percent in the first quarter, the slowest rate in 18 months, but above forecasts of 7.3 percent. Traders said the slowing pace of growth raised some hopes of more stimulus from the Chinese government.
Equities advanced for the most part Thursday on an easing of tensions regarding Ukraine. Also, earnings from GE and Morgan Stanley topped estimates.
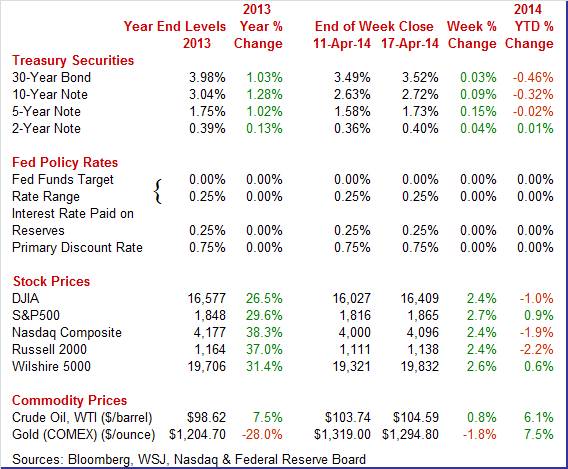
Equities were up sharply this past week. The Dow was up 2.4 percent; the S&P 500, up 2.7 percent; the Nasdaq, up 2.4 percent; the Russell 2000, up 2.4 percent; and the Wilshire 5000, up 2.6 percent.
For the year-to-date, major indexes are mixed as follows: the Dow, down 1.0 percent; the S&P 500, up 0.9 percent; the Nasdaq, down 1.9 percent; the Russell 2000, down 2.2 percent; and the Wilshire 5000, up 0.6 percent.
Weekly percent change column reflects percent changes for all components except interest rates. Interest rate changes are reflected in simple differences.
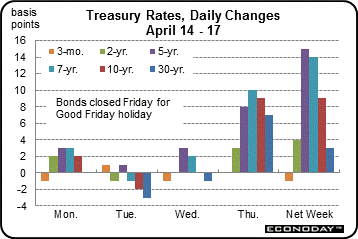 Treasury yields headed back up this past week and it mostly was a reversal of flight to safety from the prior week as money flowed into stocks. Treasury rates oscillated the first three days of the week but showed little movement. On Thursday, the last day of trading for the week, rates rose notably. Trading was thin and a better-than expected Philly Fed manufacturing report helped lift rates. Again, reversal of flight to safety also played a key role. Also, some traders saw favorable data as leading to an earlier rise in Fed policy rates next year. Treasury yields headed back up this past week and it mostly was a reversal of flight to safety from the prior week as money flowed into stocks. Treasury rates oscillated the first three days of the week but showed little movement. On Thursday, the last day of trading for the week, rates rose notably. Trading was thin and a better-than expected Philly Fed manufacturing report helped lift rates. Again, reversal of flight to safety also played a key role. Also, some traders saw favorable data as leading to an earlier rise in Fed policy rates next year.
For this past week Treasury rates were up as follows: the 2-year note, up 4 basis points; the 5- year note, up 15 basis points; the 7-year note, up 14 basis points; the 10-year note, up 9 basis points; and the 30-year bond, up 3 basis points. The 3-month T-bill edged down 1 basis point.
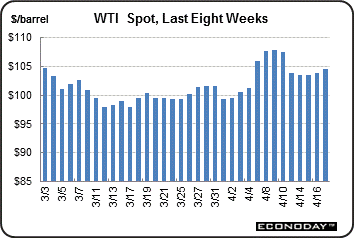 The spot price of crude was up marginally last week and was headed back up on the margin. The spot price of crude was up marginally last week and was headed back up on the margin.
Prices were stable the first three days of trading. On Thursday, WTI gained somewhat under a dollar a barrel on favorable economic news—Philly Fed. However, Brent slipped on an easing of tensions regarding Ukraine. NYMEX was closed Friday.
Net for the week, the spot price for West Texas Intermediate edged up 85 cents per barrel to settle at $104.59.
The economy is looking stronger this week, based on the latest economic news. Favorable data played a key role in lifting equities this past week.
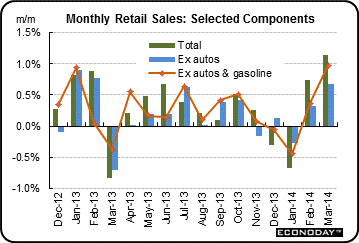 The spring rebound in economic readings may actually be taking place-at least according to retail sales. Retail sales grew 1.1 percent in March after rebounding 0.7 percent in February (originally up 0.3 percent). Much of the latest advance came from motor vehicles which jumped 3.1 percent, following a 2.5 percent rebound in February. Excluding motor vehicles, sales increased a still healthy 0.7 percent, following a gain of 0.3 percent in February. The spring rebound in economic readings may actually be taking place-at least according to retail sales. Retail sales grew 1.1 percent in March after rebounding 0.7 percent in February (originally up 0.3 percent). Much of the latest advance came from motor vehicles which jumped 3.1 percent, following a 2.5 percent rebound in February. Excluding motor vehicles, sales increased a still healthy 0.7 percent, following a gain of 0.3 percent in February.
Gasoline sales held back the total as this component declined 1.3 percent after edging up 0.1 percent in February. Other components were generally strong in March. Retail sales excluding autos and gasoline increased 1.0 percent after gaining 0.4 percent in February.
In the core, strength in March was in furniture & home furnishings; general merchandise; building materials & garden equipment; clothing & accessories stores; nonstore retailers; and food services & drinking places. The advances in furniture & home furnishings component and also building materials & garden equipment suggest that housing is having ripple effects that are boosting the economy. These gains also could be related to coming off adverse winter weather.
Weakness for March was seen in electronics & appliance stores and in miscellaneous store retailers.
Essentially, consumer spending appears to be playing catch up after consumers were forced to stay inside during adverse winter weather. Today's numbers will likely nudge up GDP forecasts for the first quarter.
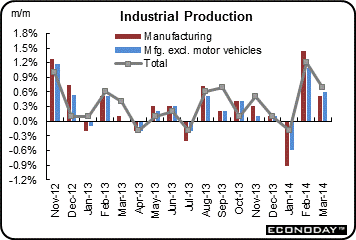 The manufacturing sector has regained momentum—probably beyond weather rebound. The manufacturing sector has regained momentum—probably beyond weather rebound.
Industrial production in March topped expectations on utilities but the manufacturing component was still quite healthy. Industrial production advanced 0.7 percent, following a rebound of 1.2 percent in February.
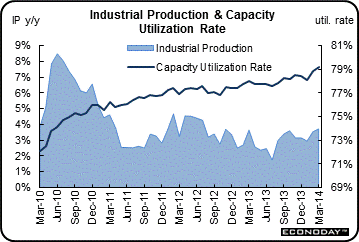 By major components, manufacturing increased 0.5 percent, following a 1.4 percent jump in February. Mining increased 1.5 percent in March after a 0.9 percent boost the month before. Utilities jumped 1.0 percent after dipping 0.3 percent in February. By major components, manufacturing increased 0.5 percent, following a 1.4 percent jump in February. Mining increased 1.5 percent in March after a 0.9 percent boost the month before. Utilities jumped 1.0 percent after dipping 0.3 percent in February.
Within manufacturing, the output of durable goods rose 0.4 percent after jumping 1.8 percent in February. Nondurable manufacturing rose 0.7 percent in March, following a 0.9 percent gain the month before.
Manufacturing excluding motor vehicles increased 0.6 percent in March, following a 1.1 percent jump in February. Capacity utilization rose to 79.2 percent from 78.8 percent in February. Expectations were for 78.7 percent.
Essentially, manufacturing is making a robust comeback after a modest dip in January. First quarter growth may be a little (emphasis on little) stronger than earlier believed.
Regional manufacturing data point in different directions for April with Empire State softening while Philly Fed is looking healthy.
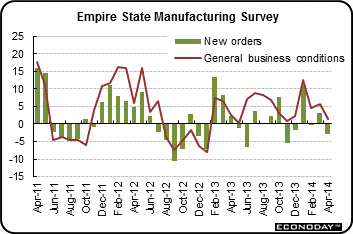 The first look at the manufacturing sector this month is flat with the Empire State index barely over zero, at 1.29 vs 5.61 in March and 4.48 in February. New orders, the most important of all readings, is in the negative column at minus 2.77. Shipments show some growth, at plus 3.15, while employment shows better growth, at 8.16 vs March's 5.88. On the negative side are unfilled orders, at minus 13.27. Inventories show a draw while price data do show some upward pressure. A positive is a more than 5 point uptick in the 6-month outlook to a very solid 38.23. This report, held back by the dip in new orders, is no better than mixed suggesting that the beginning of the spring, at least in the New York manufacturing economy, didn't make for much of a bounce. The first look at the manufacturing sector this month is flat with the Empire State index barely over zero, at 1.29 vs 5.61 in March and 4.48 in February. New orders, the most important of all readings, is in the negative column at minus 2.77. Shipments show some growth, at plus 3.15, while employment shows better growth, at 8.16 vs March's 5.88. On the negative side are unfilled orders, at minus 13.27. Inventories show a draw while price data do show some upward pressure. A positive is a more than 5 point uptick in the 6-month outlook to a very solid 38.23. This report, held back by the dip in new orders, is no better than mixed suggesting that the beginning of the spring, at least in the New York manufacturing economy, didn't make for much of a bounce.
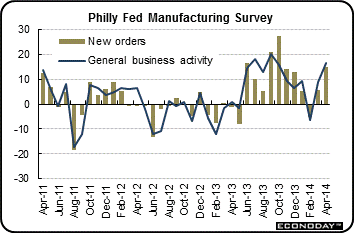 But activity in the Mid-Atlantic manufacturing sector is picking up further steam this month based on the closely watched Philly Fed index which jumped 7.6 points to 16.6 to signal the strongest rate of monthly growth since September. New orders are up 9.1 points to 14.8 for the strongest reading since December. But activity in the Mid-Atlantic manufacturing sector is picking up further steam this month based on the closely watched Philly Fed index which jumped 7.6 points to 16.6 to signal the strongest rate of monthly growth since September. New orders are up 9.1 points to 14.8 for the strongest reading since December.
Shipments have been particularly strong this month, up a very sizable 17.0 points to 22.7 for the strongest reading in more than three years. Employment also popped higher, up 4.2 points to 6.9.
Other readings include a small build for backlog orders, a small draw for inventories, and sizable slowing for delivery times -- all positive readings for activity. Price pressures remain moderate.
The Philly Fed index fell into the negative column during the unusually heavy weather of February but has since bounced back strongly for yet another indicator that is showing spring strength.
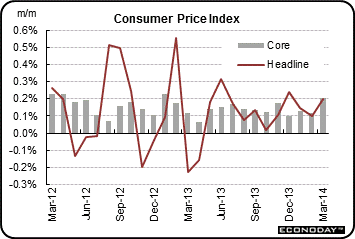 Consumer price inflation warmed up a bit in March, topping expectations at the headline and core levels. Headline inflation firmed to a 0.2 percent rise after posting a 0.1 percent rise in February. Analysts expected 0.1 percent. Increases in the shelter and food indexes accounted for most of the headline increase. Excluding food and energy, CPI inflation also rose to 0.2 percent from 0.1 percent the prior month. Market expectations were for 0.1 percent. Consumer price inflation warmed up a bit in March, topping expectations at the headline and core levels. Headline inflation firmed to a 0.2 percent rise after posting a 0.1 percent rise in February. Analysts expected 0.1 percent. Increases in the shelter and food indexes accounted for most of the headline increase. Excluding food and energy, CPI inflation also rose to 0.2 percent from 0.1 percent the prior month. Market expectations were for 0.1 percent.
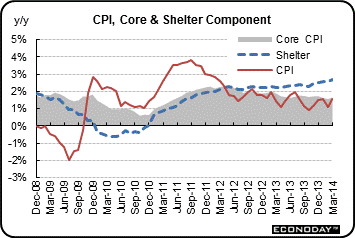 The energy component eased 0.1 percent after declining 0.5 percent in February. Gasoline fell 1.7 percent in both March and February. Food price inflation, however, continued strong with a 0.4 percent jump in each of the latest two months. The energy component eased 0.1 percent after declining 0.5 percent in February. Gasoline fell 1.7 percent in both March and February. Food price inflation, however, continued strong with a 0.4 percent jump in each of the latest two months.
Turning to the core rate, besides the 0.3 percent increase in the shelter index, the indexes for medical care, for apparel, for used cars and trucks, and for airline fares also increased. The indexes for household furnishings and operations and for recreation both declined in March.
Year-on-year, overall CPI inflation was 1.5 percent in March, compared to 1.1 percent in February (seasonally adjusted). The core rate increased 1.6 percent year-on-year, matching the rate for February. For March, not seasonally adjusted year-ago percent changes for total and core CPI were 1.5 percent and 1.7 percent, respectively.
Consumer price inflation firmed in March, but it was for just one month-not yet setting a trend. Within the Fed, the hawks likely will point to the stronger numbers while the doves will say it is too early to say that inflation is up to the 2 percent goal. Meanwhile, driving is cheaper and eating is more expensive.
The latest Beige Book does not point to an acceleration of taper.
The latest Beige Book continues much with the themes of the prior Beige Book. Most Fed Districts report economic activity to be growing at either a modest or moderate pace. Ten Districts of 12 reported that activity was up.
Consumer spending increased in most Districts, as weather conditions improved and foot traffic returned. Auto sales were up in seven Districts. Manufacturing improved in most Districts and this was partially attributed to improved weather. Several Districts reported that the impact of winter weather was less severe than earlier this year.
Reports on residential housing markets varied. However, across most Districts, home prices rose modestly and inventory levels remained low. Residential construction increased in several Districts. Commercial construction also strengthened.
Labor market conditions were mixed but generally positive. However, in most Districts, wage pressures were contained or minimal. Prices were generally stable or slightly higher.
Again, the latest Beige Book differed little from the prior one other than weather updates. Economic growth is positive but not particularly strong. Inflation is not a threat. This report points to the Fed not accelerating the pace of taper and to keeping policy rates exceptionally low for quite some time.
The spring thaw is underway. Notably, the consumer and manufacturing sectors are regrouping after the adverse winter weather and appear to be making up for lost activity.
Manufacturing and housing are highlighted this week. Industrial production has been healthy even as durables orders have averaged flat. Housing has been on a mild uptrend but based largely in the multifamily component. But the latest housing starts report showed some improvement in the single-family component. Existing home sales, new home sales, and FHFA home prices will offer important updates for the single-family home sector.
The Chicago Fed National Activity Index was pulled into positive ground in February on a weather-related rebound, to 0.14 from January's revised minus 0.45. The production component contributed 0.26 to the index versus minus 0.38 during the severe cold of January. The component for sales/orders/inventories also lifted the index, at 0.06 versus January's zero. The drag from consumption & housing eased slightly, to minus 0.16 from minus 0.19. A negative in the report, however, is the employment component, at minus 0.02 from a positive contribution of 0.11 in January.
Chicago Fed National Activity Index Consensus Forecast for March 14: 0.20
Range: 0.20 to 0.50
The Conference Board's index of leading indicators continues to confirm that the Fed’s optimism about the economy may be correct. Financial measures were mostly behind a large 0.5 percent rise in the index for February. The yield spread was once again the largest positive factor, as it has been throughout the recovery. The report's credit index was also a major positive factor, one that continues to point to improvement in lending. But there was one other major positive in this report and that was building permits where improvement tangibly points to economic strength. Negatives, however, swept five of the 10 components, including those for the factory workweek and consumer expectations. The release of March data were originally scheduled for last week but were re-scheduled from Good Friday when markets were closed.
Leading indicators Consensus Forecast for March 14: +0.7 percent
Range: +0.2 to +0.9 percent
The FHFA purchase only house price index gained 0.5 percent in January on a seasonally adjusted basis, following a 0.7 percent rise the month before. Eight of nine Census regions showed gains in the latest month while one declined. The largest regional increase was in the Middle Atlantic Census Division. The West South Central dipped 0.3 percent. The year-on-year rate posted at 7.4 percent, following 7.5 percent in December.
FHFA purchase only house price index Consensus Forecast for February 14: +0.3 percent
Range: 0.0 to +0.6 percent
Existing home sales in February, for the sixth time in seven months, contracted, at minus 0.4 percent in February following a very severe 5.1 percent contraction in January. Year-on-year, existing home sales are down 7.1 percent which is the steepest decline in nearly three years. Weak sales, however, eased supply constraints as supply at the current sales rate rose to 5.2 months from 4.9 months. And more homes came into the market, at 2.00 million versus January's 1.88 million. Heavy weather in February no doubt held down sales but there were other factors holding sales back as well, certainly the weak jobs market is not a positive. But sales very well may improve with the spring for a housing market that needs to snap back.
Existing home sales Consensus Forecast for March 14: 4.56 million-unit rate
Range: 4.45 to 4.90 million-unit rate
The Richmond Fed manufacturing index in March slipped further into negative territory to minus 7 from February's minus 6. New orders were at minus 9 for a second straight month with backlog orders at minus 13, down from minus 8 last month. Shipments were at minus 9 with capacity utilization at minus 14. Employment is at zero.
Weakness in this report underscores the unevenness in the manufacturing sector by region as activity on the national level appears to be moving forward, at least for the most part.
Richmond Fed manufacturing index Consensus Forecast for April 14: 0
Range: -3 to 6
The Markit PMI manufacturing index (final) for March was 55.5, unchanged from mid-month and a bit slower than February's 57.1. Despite the slowing, growth in March was still very solid led by new orders at 58.1. Growth in output was also very solid, at 57.5. The build in backlog orders slowed but the number was respectable at 54.5. Employment growth was steady and moderate at 53.9.
Markit PMI manufacturing flash index Consensus Forecast for April 14: 56.3
Range: 55.5 to 56.9
New home sales in February could not match the strong pace of January, coming in at an annual rate of 440,000 versus a revised 455,000 in January. But the slowing helped give supply a boost, to 5.2 months at February's sales pace versus 5.0 months in January. Supply has been thin in the housing market which has been a major factor holding down sales. Total new homes on the market increased slightly in the month and, at 189,000, are at their highest level since December 2010.
New home sales Consensus Forecast for March 14: 455 thousand-unit annual rate
Range: 440 thousand to 470 thousand-unit annual rate
Durable goods orders continue to be difficult to read. Momentum appears to swing back and forth, leaving the trend essentially flat. The latest durables orders report was mixed with the headline strong and the core slowing. New factory orders for durables in February rebounded 2.2 percent, following a decrease of 1.4 percent in January. But excluding transportation, durables orders slowed to a 0.1 percent rise in February, following a 0.9 percent boost the prior month. The transportation component jumped a monthly 7.0 percent after dropping 6.2 percent the month before. Within transportation, the gain was led by increases in orders for defense aircraft although nondefense aircraft and motor vehicles also were strong. Outside of transportation, orders were up slightly but very mixed by subcomponents. Numbers reflect revisions from the more recent total factory orders report.
New orders for durable goods Consensus Forecast for March14: +2.0 percent
Range: 0.0 percent to +3.5 percent
New orders for durable goods, ex-trans., Consensus Forecast for March 14: +0.9 percent
Range: +0.2 percent to +1.2 percent
Initial jobless claims may be having seasonal adjustment issues tied to Easter, but unemployment claims nevertheless are signaling very solid improvement in the jobs market. Initial claims came in at a better-than-expected 304,000 in the April 12 week, just under Econoday's low estimate. The prior week, which saw a major break lower, was revised only 2,000 higher to 302,000. The April 12 week is the sample week for the monthly employment report and the comparison with the March 15 sample week shows a sizable 19,000 improvement.
Jobless Claims Consensus Forecast for 4/19/14: 313,000
Range: 310,000 to 335,000
The Kansas City Fed manufacturing index increased in March, and producers' expectations were mostly stable at solid levels. The report partly attributed improved activity to better weather conditions. The month-over-month composite index was 10 in March, up from 4 in February and 5 in January. The composite index is an average of the production, new orders, employment, supplier delivery time, and raw materials inventory indexes. The production index jumped from 3 to 22, its highest level in 3 years, and the shipments and new orders indexes also climbed higher. The order backlog index edged up from minus 4 to minus 1, and the new orders for exports index also increased slightly.
Kansas City Fed manufacturing index Consensus Forecast for April 14: 8
Range: 5 to 10
The Markit PMI services index got a weather-related lift in March, rising 2.0 points to 53.5 and little changed from March's flash reading of 55.5. But details showed less strength with outstanding business, at 48.3, down 1.6 points from February and showing outright contraction for March. New business did grow, at 53.0, but at a slower pace than February's 56.0. Employment growth remained very slow for this sample, little changed and only slightly above 50 at 51.8. Price readings remained moderate. One positive was a 3.0 point rise in business expectations, to a very optimistic 76.4.
Markit PMI services index (flash) Consensus Forecast for April 14: 56.2
Range: 55.0 to 57.0
The Reuter's/University of Michigan's consumer sentiment index for mid-April gained—likely with a little help from improved weather. Consumer sentiment was up, at 82.6 for mid-April versus 80.0 in final March and versus 79.9 for mid-March. The reading is the highest since July last year. Both components were up with expectations at 73.3 versus a final March reading of 70.0 and current conditions at 97.1 versus 95.7. The gain for expectations points to rising confidence in job and income prospects while the rise in current conditions offers an early hint of month-to-month consumer strength for April.
Consumer sentiment Consensus Forecast for final April 14: 82.5
Range: 81.5 to 84.0
R. Mark Rogers is the author of The Complete Idiot’s Guide to Economic Indicators, Penguin Books.
He can also be found on a weekly broadcast talking about the U.S. economy, the easiest way to find him is by going to iTunes and searching for "Simply Economics."
Econoday Senior Writer Mark Pender contributed to this article.
|
