Long Term Perspective
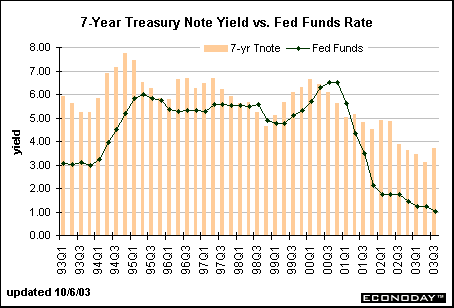
In the 1980s, the spread between the 7-year note yield and the federal funds rate averaged -183 basis points. The 1980s was generally a period of high interest rates and relatively high inflation - at least in the first half of the decade. The spread turned around in the 1990s and averaged +138 basis points (where 7-year note yields were higher than the funds rate).

Short Term Perspective
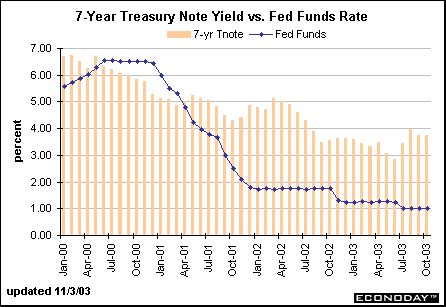
The spread between the 7-year note yield and the federal funds rate averaged +119 basis points from 2000 to 2002. The spread was negative in 2000 and early 2001 before the Fed began to aggressively reduce the federal funds rate target. Yields were about unchanged on average in October relative to September, although yields were higher at month-end than they were at the beginning of the period.


About the Bond Market • Bond Market Charts • Treasury Market Charts • Treasury Auctions
|