Long Term Perspective
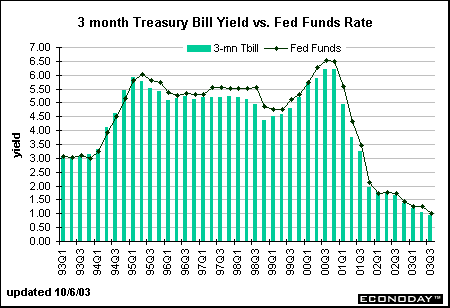
The yield on the 3-month Treasury bill is typically lower than the federal funds rate. In the 1980s, the 3- month bill averaged 49 basis points less than the funds rate, but in the 1990s this average fell to 18 basis points.

Short Term Perspective
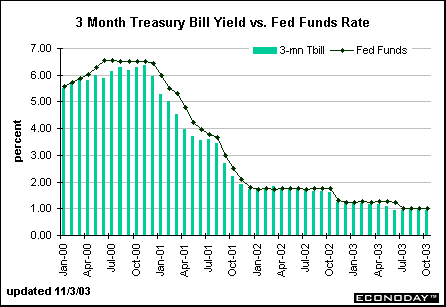
The spread between the 3-month Treasury bill and the federal funds rate averaged -24 basis points between 2000 and 2002. This means that the 3-month bill yield was typically 24 basis points lower than the federal funds rate. From December 2001 through April 2003, the two rates appear identical, but the 3-month bill yield is actually somewhat lower than the fed funds rate target. The gap between the 3-month bill and the fed funds target remained about unchanged in October.


About the Bond Market • Bond Market Charts • Treasury Market Charts • Treasury Auctions
|