 |

Long Term Perspective
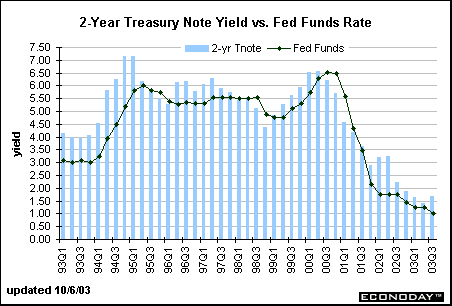
A period of high inflation and high interest rates caused the spread between the 2-year Treasury note and the federal funds rate to average -150 basis points in the 1980s. This means that the overnight federal funds rate was higher than the 2-year note over a large part of this decade. In the 1990s, however, the spread was +62 basis points - that is, the yield on the 2-year note was higher than the fed funds rate.

Short Term Perspective
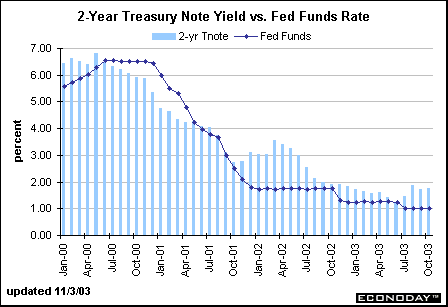
The spread between the 2-year note and the federal funds rate averaged 30 basis points from 2000 to 2002. In early 2000, economic conditions were strong, but this changed in mid-2001 and bond investors began to anticipate Fed easing. After the Fed lowered the fed funds rate target several times in 2001, the yields were in greater alignment. Between October 2001 and December 2002, the 2-year note yield once again surpassed the fed funds rate. In the early part of this period, market players were no longer expecting the Fed to reduce rates in 2002. In fact, the Fed reduced the funds rate target 50 basis points in November. As 2002 came to a close, investors concluded that the Fed was not ready to raise rates in the near term. Furthermore, whenever stock prices collapse or geo-political pressures abound, Treasury securities are investors' safe haven.
The 2-year note yield edged up 4 basis points in October relative to the September average. Yields fluctuated sharply over the course of the month with the ebb and flow of economic indicators.

 |


About the Bond Market • Bond Market Charts • Treasury Market Charts • Treasury Auctions
|
 |