Long Term Perspective
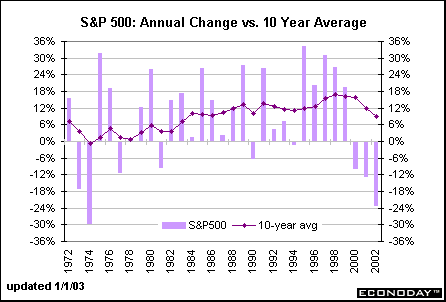
The second half of the boom-boom 1990s is only a dream to investors these days. The stock market declines accelerated between 2000 and 2002. Nevertheless, it is more realistic to look at long-term trends in the stock market to get a better picture of potential returns going forward. Extrapolating just from the past few years would be erroneous whether we would expect extraordinary returns - or losses. Studies have shown that the long-term average return in the stock market - dating back to the turn of the (20th) century - was roughly 10 percent per year. The three-year drop brought down the 10-year average to 9.1 percent in 2002, from an 11.8 percent average in 2001. Short Term Perspective
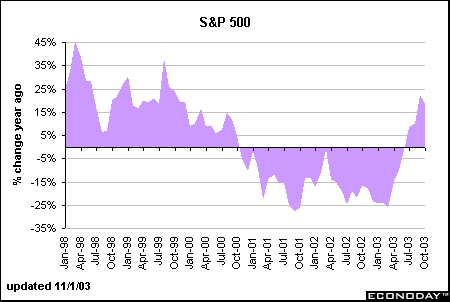
The S&P 500 surged 18.6 percent in October versus a year ago; it was the fourth straight monthly gain after two and one-half years of declines.
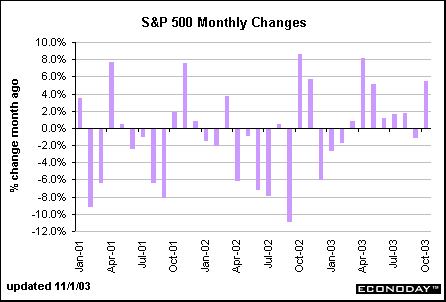
The S&P 500 index increased 5.5 percent in October, once again regaining its upward path. It was on par with the gain in the Dow Jones Industrials during the month. This index measures large cap stocks. Note that the Mid Cap and Small Cap indexes in this family posted larger monthly gains.
|
|||


