Long Term Perspective
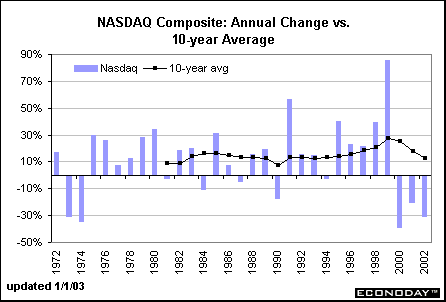
The NASDAQ composite index fell for the third straight year in 2002. The drop in the NASDAQ in 2000 was the largest in the history of the series - but then it followed the largest annual gain (85.6 percent) in 1999. Even with the three-year declines, the 10-year average was 12.9 percent in 2002, higher than the S&P 500 and the DJIA. Since this market tends to include new and growing companies, it shouldn't be surprising that the long-term annual gain is larger than it is for the S&P 500 or the Dow Jones Industrials. Both of those indices measure the performance of older, more established companies. Short Term Perspective
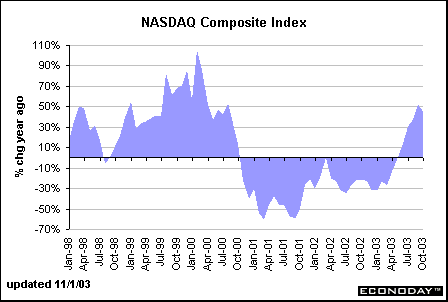
This chart underscores the high volatility of this market. The Nasdaq composite is known for its focus on high tech companies. It also includes industrials, banks, insurance, transportation and biotechnology stocks. Historically, newer companies that were not able to meet requirements for listing on the New York Stock Exchange (NYSE) or the American Stock Exchange (AMEX) were traded on Nasdaq. In recent years, some big names (Microsoft, Intel, Sun Microsystems, Cisco Systems) have remained on Nasdaq even though they could have listed on the NYSE. In October, the NASDAQ composite index was a whopping 45.3 percent higher than a year ago.
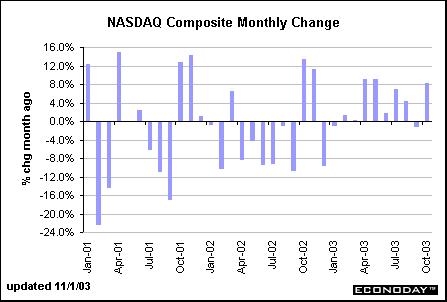
After a brief dip in September, the NASDAQ composite index jumped 8.1 percent in October. The market performed well throughout the month.
|
|||


