Long Term Perspective
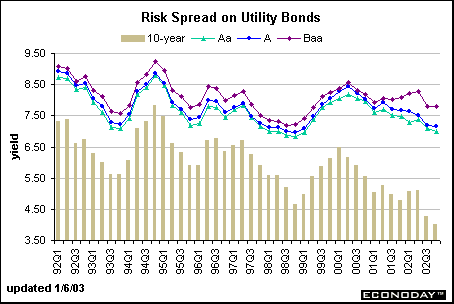
The average spread between the 10-year Treasury note yield and utility bond yields is slightly higher than for corporate and industrial bonds. Oddly enough, yields in the early 1990s were lower on utility bonds than on industrial and corporate issues. Among the various risk classes (from Aa to Baa) spreads are now wider than for the other bonds.

| Spread between Treasury Note and: | 1990s Average | 2000 to 2002 Average |
| Aa Utility Bond: | 136 basis points | 239 basis points |
| A Utility Bond: | 151 basis points | 257 basis points |
| Baa Utility Bond: | 179 basis points | 292 basis points |
Short Term Perspective
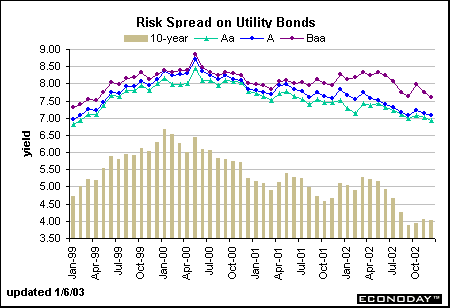
Just like corporate and industrial bonds, the spread between the 10-year Treasury yield and utility bond yields widened sharply from 2000 through 2002. This was mainly due to the diminished supply of Treasury securities, which pushed up their prices and reduced their yields. Although towards the end of 2000 and throughout 2001, it also reflected weakening economic conditions that increased default risk. Incidentally, the Triple A utility bond average is no longer calculated by Moody's because the sample size is too small.


About the Bond Market • Bond Market Charts • Treasury Market Charts • Treasury Auctions
|