 |

Long Term Perspective
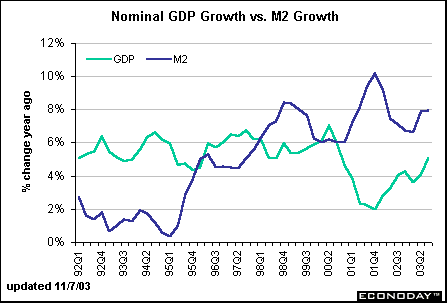
Just about every economic indicator has its fifteen minutes of fame. Money supply, released every week by the Federal Reserve, was closely watched in the 1980s. Changes in money supply are supposed to mirror changes in economic growth. The missing link in the relationship is velocity - the rate at which money turns over in the economy. As you can see from the chart, money supply (using M2 which includes currency, checking accounts, money market accounts, and small savings accounts at banks) did loosely match up with GDP growth until the 1990s when the relationship broke down. Some diehard money supply fans remain, but there really aren't any on the FOMC.

Short Term Perspective
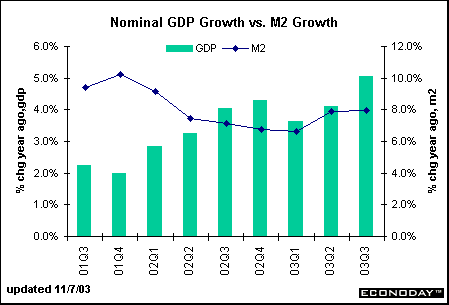
After declining its rate of growth for five quarters, M2 increased in the second quarter, but maintained its pace in the third quarter. Rising M2 levels reflect the flip side of the declining federal funds rate target, although a declining growth rate doesn't necessarily mean that the Fed has changed its interest rate target. Rapid monetary growth can lead to inflationary pressures in a fully employed economy operating at high capacity rates, but we aren't anywhere near that point now.


Fed Funds Rate Target vs. CPI Inflation • Fed Funds Rate Target vs. Discount Rate • Nominal GDP vs. M2 Growth
|
 |