| |||||||||||||||||||||||||||||||||||
| Previous Articles |
|
Stock prices edge down on earnings fears
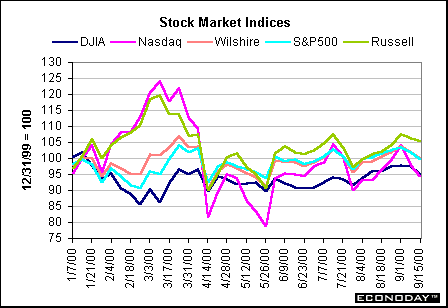
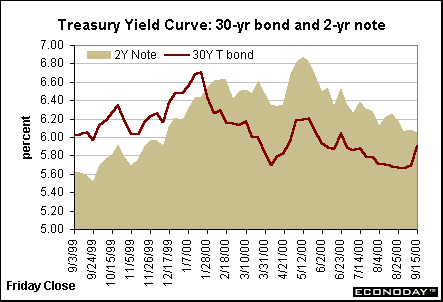
A spurt in oil prices coupled with a strong dollar (the euro hit a lifetime low) helped dampen stock prices across the board on Friday. Now, only the Russell 2000 and the Wilshire 5000 are at levels above those posted on December 31, 1999. Treasury yields edge up
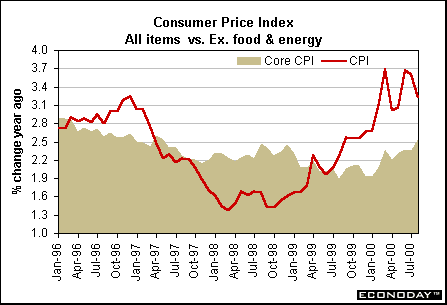
Inflationary pressures ebb The chart below shows that on a year-over-year basis, the total CPI gains appear to be moderating (although they have fluctuated more wildly than usual in the past several months). In contrast, the core CPI (excluding food and energy) is moving mildly higher on a year-over-year basis. The 2.5 percent yearly rise in August is the largest since December 1998.
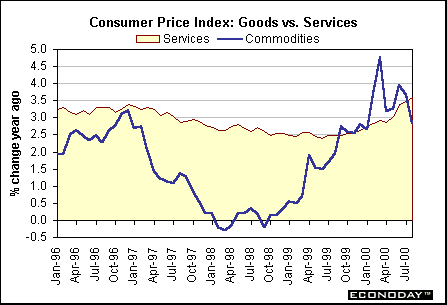
It's always interesting to see where price pressures are coming from…and in the case of the core CPI, it appears to be from services. The chart below compares yearly changes in goods and services. Energy prices are mostly in the goods index and the drop in energy prices over the past couple of months has helped dampen this index. The service sector is showing some gradual upward drift during 2000.
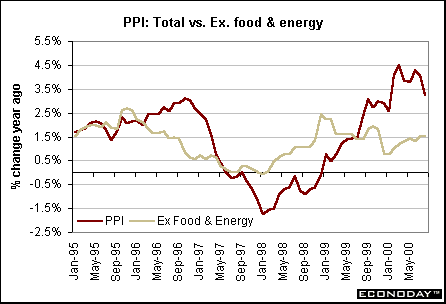
Despite the upward drift in prices of services (which is boosting the core CPI), inflationary pressures don't seem to be a major problem at this time, although these indices may keep the Fed's bias unchanged - that is, "heightened inflation risk" instead of going to a neutral bias at the next FOMC meeting. The producer price index fell 0.2 percent in August after remaining unchanged in July. Both food and energy prices dipped during the month helping to put downward pressure on the total index. As a result, the total PPI rose only 3.2 percent on a year over year basis in August compared with a 4.1 percent yearly rise last month. Crude oil prices have risen in early September, so it is possible that we will see some more energy price hikes in the next PPI. Yet, the increase is likely to be moderate relative to the past year. We've probably seen the worst of the oil story. Excluding the volatile food and energy sector, the PPI edged up 0.1 percent in August, the same as last month. This kept the yearly change for the core reading at 1.5 percent for the month. Notice the stability in this series on a year-over-year basis for the past several months. Indeed, tobacco prices once again were the main culprit lifting the core PPI in August.
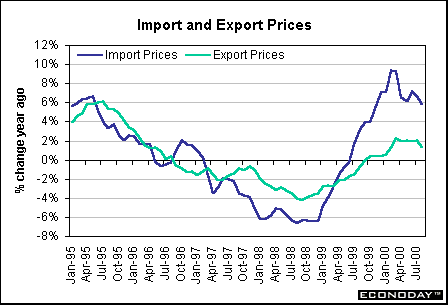
The Labor Department's report on import and export prices showed a similar pattern in that both series are exhibiting a downward trend on a year-over-year basis. The import price index is 5.8 percent higher than a year ago (down from 6.7 percent in July); the export index is up 1.3 percent from a year ago in August, less than the 2 percent annual rise posted for July. On the import price side, this mainly reflects the mid-summer dip in oil.
The bottom-line on inflation? While Fed officials should continue to maintain the bias of "heightened inflation risks" in their FOMC announcements, the inflation indicators are showing moderating pressures. As market participants become more and more convinced that inflation is not a severe problem that will worry Fed officials in coming months, it could lead to improved prices on bonds (and lower yields). This would help the equity market to some extent, although stock investors also need revenues from strong economic growth. Retail sales soften
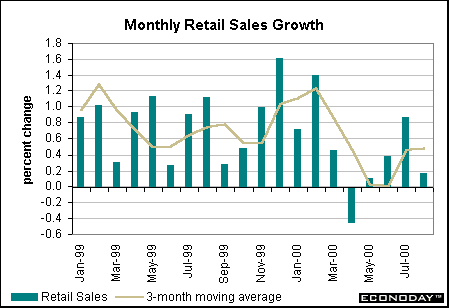
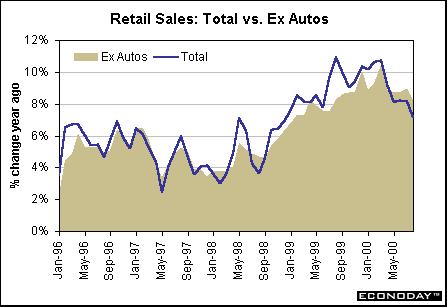
The softer trend in retail sales is also evident on a year-over-year basis. The chart below shows that retail sales peaked around the fourth quarter of 1999 (on a year-over-year basis) and have started to soften ever since. Fed officials have to be relieved at the slower pace of consumer spending.
The bottom-line on the consumer sector? Retail sales are far from dead. Consumer spending is still growing at a good clip. However, the slower pace of growth in retail sales will reassure Fed officials that economic growth is moderating and that the rate hikes of the past year are indeed having a dampening effect on economic activity. Industrial production
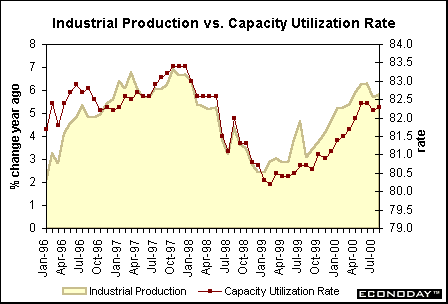
While Fed officials would like to see a moderation in economic activity, increases in business equipment is considered favorable because capital spending improves the economy's productive capacity. Going forward, production is not expected to grow very rapidly. Business inventories rose 0.2 percent in July after stronger gains in the past few months. Manufacturers' and wholesale trade inventories have accelerated in recent months suggesting that some of the build-up may be unintended and could lead to some production cutbacks. In July, retail trade inventories decreased - mostly in the auto sector. THE BOTTOM LINE Inflation news seems favorable. The consumer price index is showing some slight upward drift in the core components, but this is probably reflecting the economic strength of the past several years. The producer price index is showing more pronounced signs of moderation and this should filter through the CPI in coming months. Nevertheless, inflation remains contained. This should keep the Fed on hold through the next several months and probably through the end of the year. Looking Ahead: Week of September 18 to September 22 Tuesday Wednesday Market players will focus on the Beige book on Wednesday afternoon to see if anecdotal evidence shows that economic activity is moderating - particularly retail sales and housing activity. Furthermore, market participants will be watching if labor markets are becoming less tight or if wages are accelerating. Thursday Economists are predicting the Philadelphia Fed's business outlook survey will decrease modestly to 10 in September from a level of 14.1 in July. Any level over zero represents growth in production in this Federal Reserve district. (Forecast range: -2.0 to 12.5) The consensus shows that the federal Treasury budget should record a deficit of $10 billion in August. The federal budget is still running ahead of last year in terms of the size of the budget surplus as we head towards the end of the fiscal year in September. (Forecast range: $-15 billion to $+5.0 billion) |
||||||||||||||||||||||||||||||||||||||||||||||||||||||||||||||||||||||||||||||||||||||||||||||||||||||||||||||||||||||||||||||||||||||||||||||||||||||||||||||||||||||||||||


