|
 |
 |
No Labor Day jumpstart
Econoday Simply Economics 9/8/00
By Evelina M. Tainer, Chief Economist |
It's (not) just your imagination
If you watch daily changes in the various stock market indices, you have to be struck by the daily fluctuations. They appear amazingly large by historical standards. It makes one wonder whether our memory is just skewed or whether point changes just seem large because of increases in the index values over time. We've looked at the daily percent changes in the five major market indices -- Wilshire 5000, Dow Jones Industrials, Russell 2000, S&P 500, and NASDAQ composite -- and have indeed discovered that daily fluctuations have widened in the past five years.
Standard Deviation in Daily Changes
| DJIA | SP500 | Nasdaq | Russell | Wilshire |
| 1993 | 0.55% | 0.54% | 0.72% | | 0.51% |
| 1994 | 0.69% | 0.62% | 0.73% | 0.63% | 0.59% |
| 1995 | 0.55% | 0.49% | 0.84% | 0.52% | 0.47% |
| 1996 | 0.75% | 0.74% | 0.97% | 1.04% | 0.69% |
| 1997 | 1.18% | 1.14% | 1.16% | 0.82% | 1.01% |
| 1998 | 1.25% | 1.28% | 1.67% | 1.27% | 1.23% |
| 1999 | 1.02% | 1.14% | 1.72% | 0.90% | 1.07% |
| 2000 | 1.34% | 1.40% | 2.90% | 1.90% | 1.48% |
Overall, changes were fairly moderate from 1993 through 1996 among the five measures with little variation during the time period and even between indices. In 1997, all major indices except the Russell 2000 began to show more variation. The fluctuations increased in intensity in 1998 but fell back slightly in 1999. If you remember, 1998 included a few financial crises around the globe. Even with financial crises, it appears that markets in the year 2000 are fluctuating the most. The daily changes in the NASDAQ composite and the Russell 2000 have been particularly dramatic.
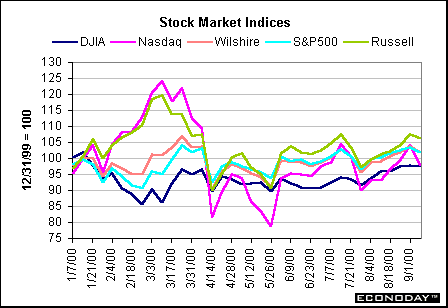
The Russell 2000, the S&P 500 and the Wilshire 5000 are above yearend levels, but the Nasdaq composite as well as the Dow Jones Industrials once again ended the week below levels posted at yearend. It is difficult to see the Wilshire 5000 line because it is generally sitting below the S&P 500 line these past few weeks.
Treasury yields remain stable
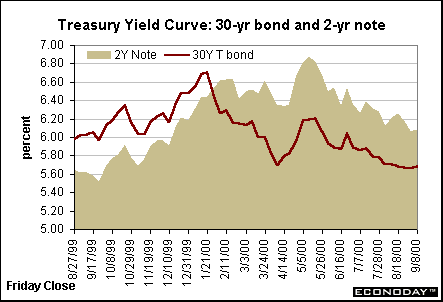
Whether it's a lack of economic data or just holiday apathy, Treasury yields have remained in a tight range these past several days. Yields ticked a bit higher at mid-week, possibly on comments by Fed officials that risks remain on the side of inflationary pressures. Yet, the economic data in the past week - from the moderate employment report to the healthy productivity data - still point to slower growth without current inflationary pressures. The one major factor that could hurt yields is higher oil prices. Crude oil futures are rising even though the Saudis have announced increases to their production schedules.
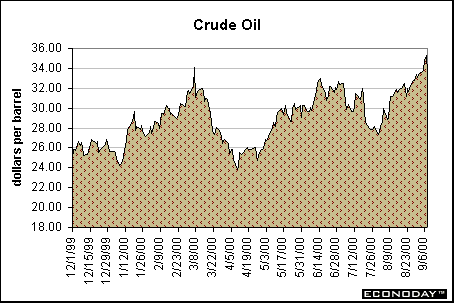
Crude oil prices jumped all the way to $35.30 on Thursday, but profit-taking brought down the Friday levels to $33.70. OPEC is meeting this Sunday. Expectations are that production will be increased by 300,000 to 500,000 barrels per day.
Markets
at a Glance
|
| Treasury Securities |
12/31/99 |
2000
High |
2000
Low |
1-Sep |
8-Sep |
Week %
Change |
| 30-year Bond |
6.48% |
6.75% |
5.66% |
5.66% |
5.70% |
0.04% |
| 10-year Note |
6.43% |
6.77% |
5.68% |
5.68% |
5.73% |
0.05% |
| 5-year Note |
6.34% |
6.81% |
5.90% |
5.90% |
5.93% |
0.03% |
| 2-year Note |
6.24% |
6.90% |
6.07% |
6.07% |
6.09% |
0.02% |
| |
|
|
|
|
|
|
| Fed Funds Rate Target |
5.50% |
6.50% |
5.50% |
6.50% |
6.50% |
0.00 |
| |
|
|
|
|
|
|
| Stock
Prices |
|
|
|
|
|
|
| DJIA |
11497 |
11723 |
9811 |
11239 |
11222 |
-0.2% |
| S&P 500 |
1469 |
1524 |
1348 |
1521 |
1495 |
-1.7% |
| NASDAQ Composite |
4069 |
5049 |
3164 |
4234 |
3979 |
-6.0% |
| Russell 2000 |
505 |
606 |
457 |
542 |
536 |
-1.1% |
| Wilshire 5000 |
13813 |
14751 |
12475 |
14330 |
14051 |
-1.9% |
| |
|
|
|
|
|
|
| Exchange
Rates |
|
|
|
|
|
|
| Euro/$ |
1.0008 |
0.8692 |
1.0336 |
0.9006 |
0.8692 |
-3.5% |
| Yen/$ |
102.40 |
111.35 |
101.45 |
105.79 |
106.21 |
0.4% |
| |
|
|
|
|
|
|
| Commodity
Prices |
|
|
|
|
|
|
| Crude Oil ($/barrel) |
$25.60 |
$35.30 |
$21.20 |
$33.35 |
$33.70 |
1.0% |
| Gold ($/ounce) |
$289.60 |
$326.00 |
$273.90 |
$280.80 |
$277.00 |
-1.4% |
| |
|
|
|
|
|
|
Productivity growth revised upward
Nonfarm business productivity grew at a 5.7 percent rate in the second quarter, up from the first quarter pace of 1.9 percent and higher than the initial estimate reported a month ago. Productivity expanded at a slower rate in both durable and nondurable manufacturing, but accelerated at nonfinancial corporations. The chart below depicts year-over-year growth in nonfarm productivity. Note that the 5.2 percent annual gain is the fastest in the past ten years. (In fact, it is the largest year-on-year gain since mid-1983 when productivity grew 5.3 percent.)
Unit labor costs in the nonfarm sector edged down at a 0.4 percent rate in the second quarter after rising at a 1.9 percent rate in the first three months of the year. While unit labor costs dropped at a 7 percent rate in durable goods manufacturing, they rose at a 4.5 percent rate in the nondurable goods sector for the second straight quarter. Unit labor costs increased at a 0.6 percent rate at nonfinancial corporations. Unit labor costs are down 0.4 percent from year ago levels, the best showing in ten years. (In fact, it is the best showing since the fourth quarter of 1983 when unit labor costs decreased by more than 1 percent from the year earlier period.)
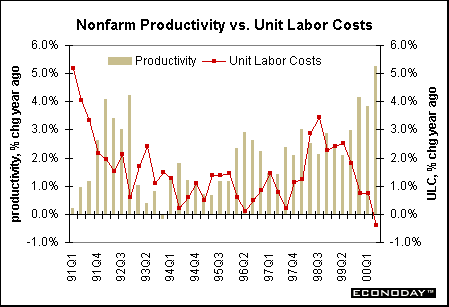
The bottom-line on productivity? These revised productivity figures were not all that different from the initial estimates, which showed a surprisingly strong trend in nonfarm productivity. Instead of moderating like it typically does at this stage of the business cycle, productivity growth appears to be accelerating. This pace may not be sustainable, but as long as productivity growth continues at a healthy rate, it means that higher wages won't translate into inflationary pressures. These figures should be reassuring to Fed officials even though some governors have recently made noises about "heightened risks toward inflation remain".
Motor vehicle sales on the upswing
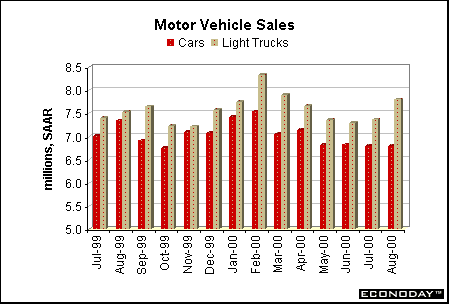
Domestic autos were sold at a 6.8 million-unit rate in August for the fourth straight month. Light trucks were sold at just under an 8 million-unit rate. While auto sales are down from their peak established in February, truck sales resumed an upward drift with particular strength in August. While owners of sports utility vehicles complained of higher gasoline prices earlier this year, it appears that higher fuel costs are not preventing consumers from buying gas guzzling vehicles.
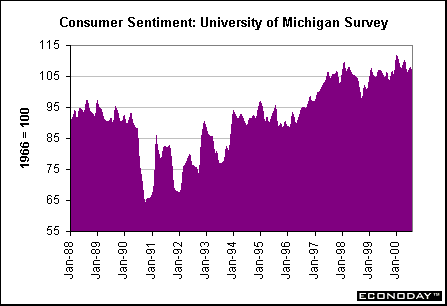
Many analysts like to follow consumer confidence measures to gauge optimism among consumers. Indeed, the University of Michigan's consumer sentiment index dipped slightly in August, but still shows a high level of confidence on the part of consumers. The confidence measures are certainly corroborated by the strong motor vehicle sales figures. After all, consumers aren't going to purchase a car - which entails a loan for 3, 4 or even 5 years - if they believe economic conditions are worsening any time soon.
The bottom-line on the consumer sector? A one-month blip in truck sales is not going to cause Fed officials undue concern. However, the key to the economic slowdown requires consumer spending to run along in line with income, not with stock appreciation. If Fed officials believe that the consumer slowdown of the past few months is only temporary, they will be inclined to raise rates to forestall further acceleration. In the meantime, though, indicators show relative stability.
Non-manufacturing NAPM: what's the point?
In mid-1998, the National Association of Purchasing Managers began to release a new indicator they called the non-manufacturing NAPM survey. Just like the regular NAPM survey, several components regarding orders, inventories, prices, employment and supplier deliveries were included. The main component that gets most of the attention is the business activity index. It is NOT a composite index like the NAPM diffusion index. It corresponds to the NAPM's manufacturing production index. But for lack of an overall measure, economists and market players focus on the business activity index.
One key problem is that none of the components (including business activity) are adjusted for seasonal variation because the series' history is not long enough. As a result, one must keep in mind normal seasonal variations when the business activity index jumps around from one month to the next. Indeed, the index rose to 60 in August from 55.5 in July - which had been down from 64 in June. What does it mean? As long as the index remains above the 50 percent mark, it means that activity is expanding.
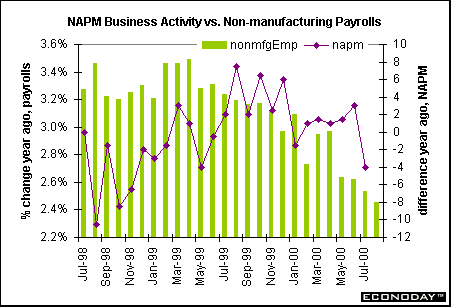
In order to see whether this index was giving us any valuable information, we compared the year over year change (to reduce seasonality) in the business activity index and compared it to the year-over-year percent change in private, non-manufacturing payrolls. While the non-manufacturing private payroll series is showing a reduction in its rate of growth, the non-manufacturing NAPM index (business activity) is not showing any clear trend at all.
The regular NAPM series has earned its credibility by its history of long-term stability and indication of manufacturing activity. The non-manufacturing NAPM doesn't reveal any real information about current economic conditions and should be considered at the bottom of the barrel in terms of new economic information.
THE BOTTOM LINE
No question about it, it was a dull week from an economic indicator perspective. Aside from motor vehicle sales, data was pretty much old news. After all, how excited can one get with an upward revision in second quarter productivity since the initial report was also pretty robust? It was definitely a good week for vacations since neither Fed officials nor investors learned anything new about current conditions.
Looking Ahead: Week of September 11 to September 15
Market News International compiles this market consensus that surveys 15 - 20 economists each week.
Wednesday
Economists are predicting import prices will rise 0.3 percent in August after a remaining unchanged in July. (Forecast range: - 0.1 percent to 0.6 percent) Export prices are expected to inch up 0.2 percent in August. (Forecast range: 0.0 percent to 0.8 percent)
Thursday
Market participants are expecting new jobless claims to increase 4,000 in the week ended September 9 from last week's 316,000 level. (Forecast range: -10,000 to +9,000)
Economists are predicting the producer price index will rise 0.2 percent in August as energy prices reverse course once again, picking up steam after dipping in the previous month. (Forecast range: - 0.1 percent to 0.4 percent) Excluding food and energy, the PPI is also expected to rise 0.2 percent for the month. (Forecast range: 0.1 percent to 0.2 percent)
The consensus shows that retail sales are expected to rise 0.4 percent in August; Excluding the auto component, retail sales are predicted to rise 0.3 percent. (Forecast range for total retail sales: 0.0 percent to 0.8 percent) This reflects a more moderate consumer pace than earlier this year. (Forecast range for non-auto retail sales: 0.0 percent to 0.5 percent)
Friday
Market participants are looking for a 0.2 percent rise in the consumer price index in August the same as the previous month. (Forecast range: 0.1 percent to 0.3 percent) Similarly, the core CPI is also expected to rise 0.2 percent for the month. Energy prices are also going to hurt the CPI this month. (Forecast range: 0.1 percent to 0.3 percent)
The consensus shows business inventories should rise 0.6 percent in July after gaining 0.9 percent in each of the previous two months. Even though inventory gains are expected to be smaller in July than May or June, sales have also softened. Consequently, this may point to an unplanned inventory build-up and could lead to slower production schedules in coming months. (Forecast range: 0.4 percent to 0.6 percent)
The index of industrial production should edge down 0.1 in August after rising 0.3 percent in the past couple of months. Economists are basing this forecast on the factory payroll and hours worked data out of the employment report. (Forecast range: -0.5 percent to 0.3 percent) At the same time the capacity utilization rate is expected to dip to 81.9 percent in August from 82.3 percent in July. (Forecast range: 81.6 to 82.4 percent)
|


