|
 |
 |
FOMC yawns ahead
Econoday Simply Economics 8/18/00
By Evelina M. Tainer, Chief Economist |
Lazy days of summer...continued
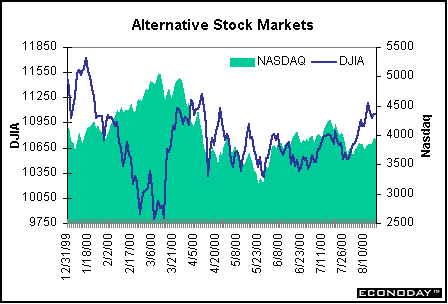
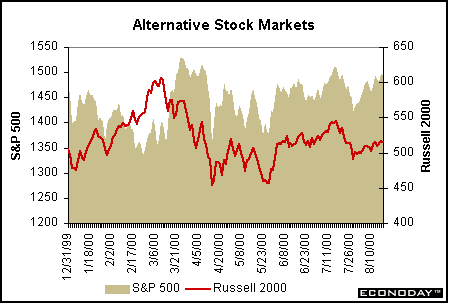
Equity prices drifted higher this past week as some corporations announced quarterly earnings. In the past couple of weeks, equity investors have grown concerned that earnings are not beating expectations -- merely matching them. This has led to an environment of buy the rumor, sell the news. It doesn't make sense that as-expected earnings should cause a company's stock price to fall even if the bottom line is good. In any case, all the major indices are drifting higher. The S&P 500 as well as the Russell 2000 have once again surpassed their levels from December 31, 1999. The Dow and the NASDAQ composite remain below these levels, however.
Lazy days of summer, bond-style
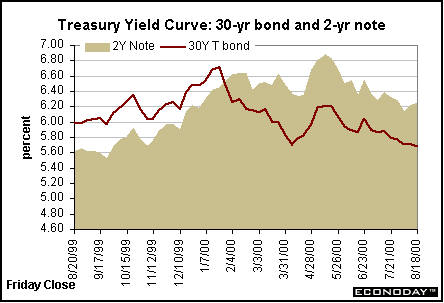
Treasury yields have remained in a fairly tight range these past couple of weeks. Sometimes economic indicators cause little upticks in the yield, sometimes they allow yields to drift slightly lower. The basic story remains the same: economic activity appears to be moderating and the Fed is not likely to tighten credit conditions before the election. If this pace continues through the end of the year, the Fed may not need to tighten after the election either. In fact, some market participants have gone so far as to consider that the next Fed move will be an ease. But we are getting a bit ahead of ourselves. In the meantime, it's steady as she goes
| Markets
at a Glance |
| Treasury Securities |
12/31/99 |
2000
High |
2000
Low |
11-Aug |
18-Aug |
Week %
Change |
| 30-year Bond |
6.48% |
6.75% |
5.70% |
5.71% |
5.69% |
-0.02% |
| 10-year Note |
6.43% |
6.77% |
5.78% |
5.78% |
5.77% |
-0.01% |
| 5-year Note |
6.34% |
6.81% |
6.01% |
6.06% |
6.08% |
0.02% |
| 2-year Note |
6.24% |
6.90% |
6.13% |
6.22% |
6.26% |
0.04% |
| |
|
|
|
|
|
|
| Fed Funds Rate Target |
5.50% |
6.50% |
5.50% |
6.50% |
6.50% |
0.00% |
| |
|
|
|
|
|
|
| Stock
Prices |
|
|
|
|
|
|
| DJIA |
11497 |
11723 |
9811 |
11028 |
11046 |
0.2% |
| S&P 500 |
1469 |
1524 |
1348 |
1472 |
1492 |
1.3% |
| NASDAQ Composite |
4069 |
5049 |
3164 |
3789 |
3930 |
3.7% |
| Russell 2000 |
505 |
606 |
457 |
510 |
516 |
1.1% |
| Wilshier 5000 |
13813 |
14751 |
12475 |
13704 |
13907 |
1.5% |
| |
|
|
|
|
|
|
| Exchange
Rates |
|
|
|
|
|
|
| Euro/$ |
1.0008 |
0.8893 |
1.0336 |
0.9027 |
0.9064 |
0.4% |
| Yen/$ |
102.40 |
111.35 |
101.45 |
108.68 |
108.42 |
-0.2% |
| |
|
|
|
|
|
|
| Commodity
Prices |
|
|
|
|
|
|
| Crude Oil ($/barrel) |
$25.60 |
$34.05 |
$21.20 |
$31.15 |
$31.95 |
2.6% |
| Gold ($/ounce) |
$289.60 |
$326.00 |
$273.90 |
$280.50 |
$281.80 |
0.5% |
| |
|
|
|
|
|
|
Inflation in check
The consumer price index increased 0.2 percent in July after a sharper 0.6 percent gain in June. Energy prices edged up 0.1 percent during the month because of electricity rate hikes on the east and west coasts. Gasoline prices did decline (most sharply in the Midwest). Food prices increased 0.5 percent in July. This brought the yearly rise in the CPI to 3.5 percent, just a tick lower than the previous month's year-on-year gain.
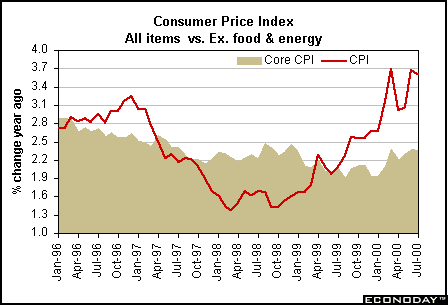
Excluding the volatile food and energy components, the CPI increased 0.2 percent, the same pace as the previous three months. Among the major categories, apparel prices dropped. Slower gains were recorded in housing and medical care. Education costs rose more moderately than in June, but communication prices (telephone services) jumped 0.8 percent after declining in the previous few months. Tobacco prices surged 3.1 percent, lifting the "other goods and services" category. On a year-over-year basis, the core CPI is up 2.4 percent in July, the same as last month.
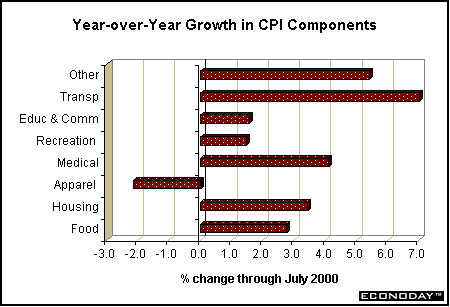
The bottom-line on inflation? The consumer price index was in line with expectations. Market players and government officials were not cowed by this inflation report. All in all, inflation news remains encouraging and should not be a concern for Fed officials when they determine the course of monetary policy at next week's FOMC meeting. These figures certainly would allow them to remain on hold.
Housing demand moderates
Housing starts fell 3.3 percent in July after dropping 1.8 percent in June. At a 1.512 million unit rate, housing starts are down 11.3 percent from year ago levels. According to the chart below, it appears that new housing construction peaked before mortgage rates hit their highs for this cycle. Single-family housing starts dropped 2 percent in July and are down 11.2 percent from year ago levels. Economists and Fed officials monitor single family housing more closely than the more volatile multi-family construction, especially because the former is more sensitive to interest rates while the latter may be more speculative in nature.
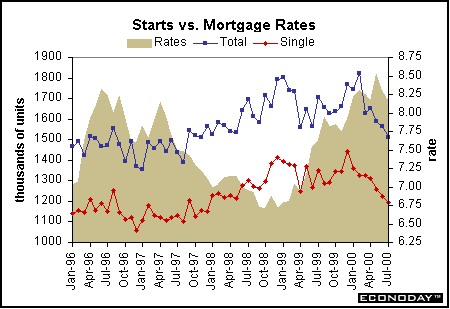
Despite the noticeable downward trend in housing construction, there is no question that the overall pace of housing activity remains quite healthy by historical standards. While starts are down from the average pace in 1999, it is worth remembering that economists were claiming that housing activity was strong in 1996 and 1997 -- this before the 1998-99 boom. We're still higher than the mid-1990s pace.
The bottom line on housing starts? The overall level of housing activity is still quite robust and indicative of a healthy economy. However, starts are off their peak and this will encourage Fed officials to conclude that their rate hikes of the past year have affected consumer demand. The slower pace of housing starts and home sales reduces the demand for furniture and appliances. Indeed, retail sales have already moderated in these sectors. The housing data supports a Fed strategy of remaining on hold at the upcoming FOMC meeting.
Healthy production concentrated in capital spending
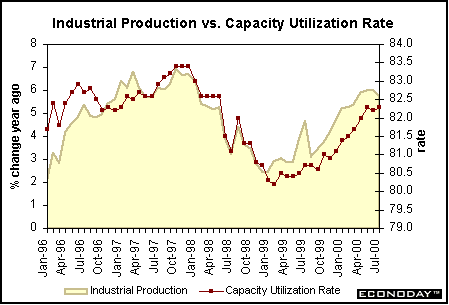
The index of industrial production increased 0.4 percent in July, twice as fast as in June, but slower than the previous couple of months. Nevertheless, the yearly rise in production stood at a healthy 5.8 percent. The production figures should be encouraging to Fed officials who are looking for a moderation in the pace of consumer spending. Production of consumer goods fell 0.5 percent in July after anemic activity in the past few months , and is only 1 percent higher than a year ago. In sharp contrast, business equipment production jumped 1.3 percent in July, bringing the yearly gain to 9.3 percent. When production gains are centered in the capital goods arena, it portends further productivity-enhancing projects. This bodes well for economic conditions in the long run by allowing wage increases and keeping inflation under control at the same time. The capacity utilization rate remains below 83 percent which can start to signal inflationary pressures.
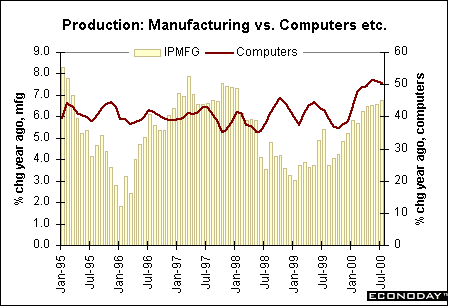
The chart below compares yearly gains in manufacturing production relative to gains in the more specific category of computers, communications equipment and semiconductors. Notice the pronounced cyclical movement in manufacturing production since January 1995 and a more modest variation in the computer industry with yearly gains between 40 and 50 percent! The high tech industry slowed at year-end 1999 (that old Y2K situation) and has since burgeoned.
Production has also been spurred by improvement in the foreign sector. The international trade deficit on goods and services did widen slightly in June to $30.6 billion, although the chart below suggests that the trade deficit has remained relatively stable these past three months. Imports gained 3.7 percent in June, but have softened on a year-over-year basis in the past couple of months. Conversely, exports jumped 4.6 percent in June and have posted steadily higher gains in the past year. Incidentally, some of the higher import demand stems from rising oil prices rather than robust increases in autos or other consumer goods (although these have recorded healthy gains in recent months).
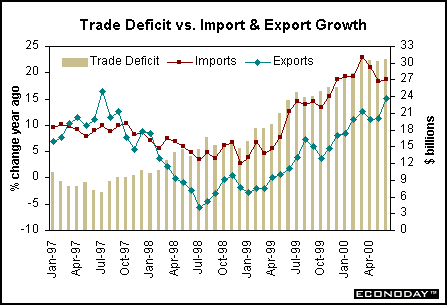
The bottom-line on production? Although industrial production is expanding at a moderately fast pace, growth is concentrated in productivity-enhancing sectors. Similarly, at least half of the jump in imports came from the capital goods sector. Increases in capital spending enhance the nation's wealth over the long run. It allows for improved living conditions without strong inflationary pressures. These figures will allow Fed officials some leeway in setting the course of monetary policy this summer, and will likely keep them on hold at next week's FOMC meeting.
THE BOTTOM
LINE
The bulk of this week's key economic information was reported at mid-week: the consumer price index and housing starts. The combination of slower housing demand with no acceleration in the pace of inflation reassured market participants that Fed officials are likely to stand pat at next week's FOMC meeting. Most economists and market players do anticipate that the balance of risk statement will focus on potential for inflationary pressures (still).
Market players will grow more confident that the Fed will stand aside as the much discussed election period heats up, on the assumption it will not want to cause ripples in the political waters. As long as inflation doesn't rear its ugly head (with a sudden spurt in average hourly earnings, the CPI or the PPI) and retail sales remain quiet, then monetary policy should remain in a holding pattern. But make no mistake, if Fed officials believe that conditions warrant a rate hike, they will act , even in the month before the election (October 3 is the next meeting).
Looking
Ahead: Week of August 21 to August 25
Market News International compiles this market consensus which surveys about 20 economists each week.
Tuesday
The Federal Open Market Committee (FOMC) is meeting today. Economists and market participants expect the Fed to leave rates unchanged; that is, the federal funds rate target should remain at 6.50 percent. Economists are predicting, however, that the Fed will announce that the balance of risks remain concentrated towards potential inflationary pressures.
Thursday
Market participants are expecting new jobless claims to edge down 3,000 in the week ended August 19 from last week's 313,000 level. Data may be affected by the telecomm workers strike, so the range is wider than usual. (Forecast range: -13,000 to +12,000)
The consensus forecast is looking for durable goods new orders to drop 6.5 percent in July reversing nearly two-thirds of the 9.7 percent spurt posted in June. This is due to the volatile aircraft sector. New orders should continue their moderate upward trend otherwise. (Forecast range: -0.5 to ,8.5 percent)
Friday
The consensus forecast is looking for real GDP to expand at a 5.5 percent rate, up from the 5.2 percent rate reported earlier. In part, this reflects the upward revision to the export figures and the strong June export data. (Forecast range: 5.2 to 6.0 percent) The deflator should remain unchanged at a 2.5 percent rate. (Forecast range: 2.3 to 2.5 percent)
Existing home sales are expected to decrease 2.5 percent in July to a 5.10 million-unit rate after posting increases in each of the previous two months. Existing home sales have shown somewhat more strength than new home sales and single-family housing starts in the past couple of months. Generally, these three series move in tandem, so a correction is likely. (Forecast range: 4.90 million to 5.30 million-unit rate)
|


