| |||||||||||||||||||||||||||||||||||


| Previous Articles |
|
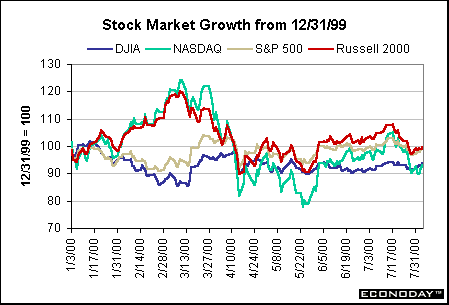
Equities
in summer doldrums
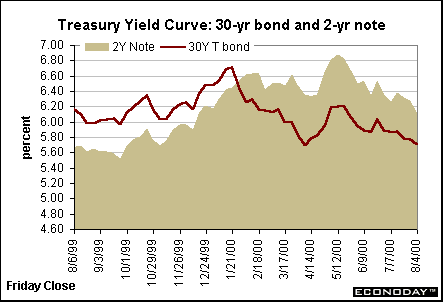
Statements
by U.S. Treasury officials major market mover The employment situation eased fears that the Fed would raise rates at the August 22 FOMC meeting. As a result, yields declined across the spectrum of maturities on Friday to their lowest level of the week.
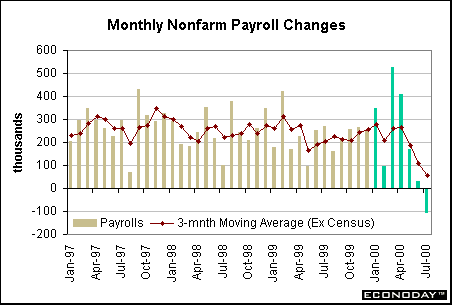
Employment
trends lower
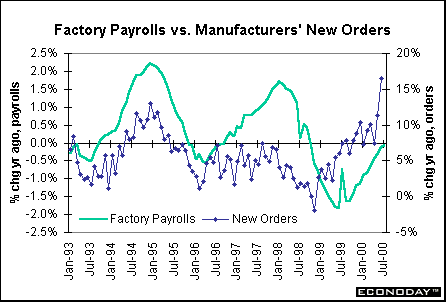
The moderation in nonfarm payrolls came mostly from the service-producing sector where gains were generally modest, while the important business & health services component actually remained unchanged for the month. In contrast, factory payrolls jumped 46,000 - a far cry from the sluggish behavior of the past several months. Labor Department officials weren't sure whether changing seasonal factors or actual gains in demand boosted manufacturing employment. The chart below depicts yearly gains in factory payrolls relative to annual increases in factory orders. Note that the trend is pointing upward in both cases and these two series have moved together historically. The upward trend in new orders does correspond with the upward trend in manufacturing employment. Perhaps this will be sustained past the summer months.
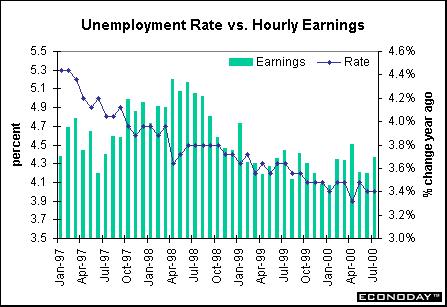
The civilian unemployment rate remained unchanged at 4 percent in July. Both the labor force and household employment fell during the month. Greenspan & Company are likely to be reassured with the modest rise in the pool of available labor. But despite the rise in July, this series nevertheless is exhibiting a strong downward trend. It will take more than one month's rise to motivate the belief that labor markets are no longer tight.
Average hourly earnings rose 0.4 percent in July after posting smaller gains in the past couple of months. This put the yearly rise at 3.7 percent, up from the past two months. Yet, as indicated in the chart above, the yearly uptick in average hourly earnings still falls within the range of the past twelve months and is not showing strong signs of acceleration. The bottom-line on the employment situation? The employment situation for July reveals that the trend towards more moderate employment growth, which began a few months ago, has continued. In addition to the slower pace of employment growth, the average workweek is also exhibiting some downward drift suggesting that total hours worked in the economy is indeed less robust that earlier this year. The civilian unemployment rate has stabilized at 4 percent for the past nine months. While average hourly earnings ticked higher in July, the trend here is nearly constant for the past several months as well. Even Labor Secretary Alexis Hermann noted that productivity gains are likely to offset the rise in wages (and alleviate potential inflationary pressures). These figures will go a long way in reassuring Fed officials that the rate hikes of the past year are indeed hampering economic growth. This could keep the Fed on hold at the August 22 FOMC meeting. Consumer
sector moderating ... on the whole
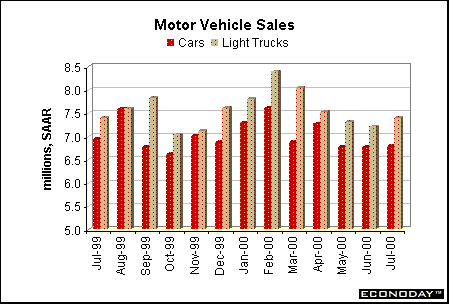
Motor vehicle sales are also on a decided downward trend since reaching a peak in February. Though light truck sales ticked higher in July, they were weaker in May and June, while autos have sold at a 6.8 million-unit rate for the past three months. Despite the moderation in car and truck sales the past several months, there is no question that the overall sales pace remains high.
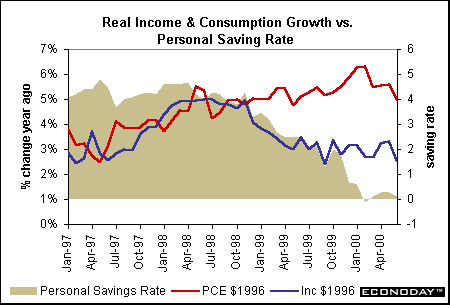
Overall consumer expenditures have moderated in the past several months. Personal consumption expenditures posted an average increase of 0.2 percent in the past four months through June. This is just slightly lower than the average gain of 0.25 percent for disposable income over the same period. As indicated by the chart below, the gap between income and consumption doesn't seem to be narrowing. The personal savings rate dipped to 0.1 percent in June after reaching 0.3 percent in the previous two months. As long as consumers don't pick up their savings, it reflects a strong sense of optimism about the economy. Even though stock prices are down from year-end levels, they clearly aren't weak enough to entice consumers into a more austere savings program.
The bottom-line on the consumer sector? Consumer demand is not as robust as it was earlier this year. Even with declines in home sales and motor vehicle sales, though, overall levels are still fairly healthy by historical standards. Consumer indicators generally suggest a sufficiently slower pace of growth, likely satisfying Fed officials (at least for the time being) into leaving the federal funds rate target unchanged at the August FOMC meeting. Manufacturing:
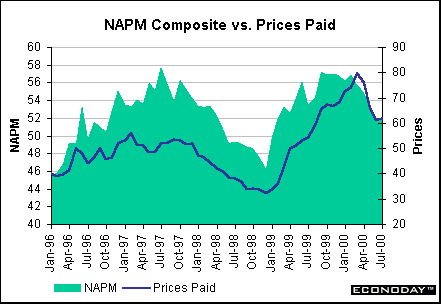
a mixed bag In contrast, the NAPM survey was unchanged in July at 51.8. This put the June and July figures at their lowest level since January 1999 when the index dipped below the 50 percent mark. Most of the NAPM components posted declines for the month, although many series remained above 50 percent. The new orders index, however, did dip to 49.9 percent in July - perhaps suggesting that factory orders have peaked in the second quarter. It remains to be seen whether this is just a one-month dip or the beginning of a new downward trend.
The NAPM's prices paid component edged up to 61.9 in July from 61.2 in June. Despite the uptick, the level is down from its peak of a few months ago. This still mostly reflects higher energy prices. Other raw materials prices may have increased modestly as well. Fed officials would surely like to see this index come back down below the 50 percent mark. THE BOTTOM
LINE Consumer indicators were both better and worse than the previous month. Motor vehicle sales were up slightly in July from June, but remain well below the February peak. Sales of new single family homes did drop to their lowest level in over 18 months, but the quarterly pace of total single family home sales (including existing homes) rose modestly during the second quarter. Again, sales are well below the peak reached late last year. The only piece of inflation news (aside from the purchasing managers' surveys) was a 0.4 percent rise in average hourly earnings. This led to a slight uptick in the year-over-year gain, but at 3.7 percent this remains in line with recent months. This alone shouldn't be the sole reason for a Fed tightening in August. Several more key economic indicators are scheduled for release before the August 22 FOMC meeting. These include retail sales for July as well as the PPI and CPI for July. Scary inflation numbers with a rebound in retail sales might possibly cause some concerns among Fed officials that would lead to a rate hike. But moderate numbers as we've seen should keep the Fed on hold. Looking
Ahead: Week of August 7 to August 11 Monday
Tuesday
Wednesday
Thursday
Friday
Retail sales are expected to rise 0.4 percent in July after gaining 0.5 percent in June. Auto and truck sales were running at nearly the same pace as last month. (Forecast range: + 0.2 percent to + 0.7 percent) Excluding the auto group, retail sales should also increase 0.4 percent in July after a modest 0.2 percent gain in June. (Forecast range: + 0.1 percent to + 0.5 percent) |
||||||||||||||||||||||||||||||||||||||||||||||||||||||||||||||||||||||||||||||||||||||||||||||||||||||||||||||||||