| |||||||||||||||||||||||||||||||||||
| Previous Articles |
|
As FOMC
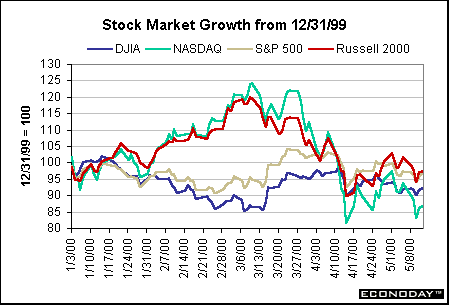
approaches, equity investors rethink positions The Russell 2000, which measures small-cap stocks, is heavily affected by the high tech industry, and the index moved in tandem with the NASDAQ composite for much of this year. However, these two measures de-coupled in mid-April. To date, the Russell 2000 remains the strongest of the major four indices we follow in the chart below. The NASDAQ composite remains well below the Dow these days in terms of change since yearend.
Treasury
market prices in 50 basis points by Fed
Inflation
news better, but not best
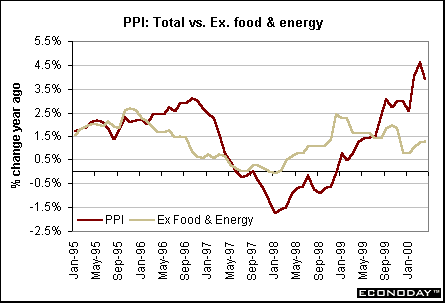
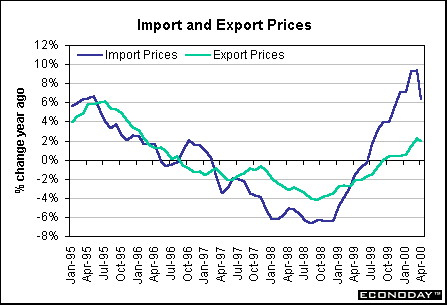
Excluding food and energy prices, the PPI inched up 0.1 percent in April, matching the March gain. This put the year-over-year gain at 1.3 percent, nearly on par with last month’s 1.2 percent hike. The chart depicting year-over-year gains in the total and core PPI suggests that the worst inflation news may be behind us. However, crude oil prices have shot up again in recent weeks, so it may take longer than a few months to wring out some of the energy price pressures. Analysts within and outside the Federal Reserve System also look at the producer price index for early stages of processing. The PPI for intermediate goods edged down 0.1 percent, but the nonfood, nonenergy component increased 0.4 percent for the third time in four months. The crude materials index is less problematic, falling 2.5 percent in April. Even excluding food and energy components, the crude materials index fell 1.2 percent in April, its third straight monthly decline. The Labor Department’s report on import and export prices also showed some improvement on the inflation front. Import prices decreased 1.6 percent – coming entirely from a plunge in petroleum import prices. However, non-oil import prices edged up a meager 0.1 percent, slower than the past two months. At the same time, export prices edged down 0.1 percent, with a 0.2 percent drop in non-agricultural prices. But on a year-over-year basis, import prices remain high, despite the April drop.
The bottom line on inflation? The inflation reports were not a surprise to analysts or market players as they mainly reflected an expected drop in energy prices. Apart from the moderate gain in the nonfood, nonenergy PPI for intermediate materials, news on the core components was relatively favorable, or at least stable. The charts don’t really point to runaway inflation. In a vacuum, the inflation news alone might not be sufficient to spur Fed officials into a more aggressive tightening stance. But the inflation news will be viewed in the context of strong consumer demand and tight labor markets. Indeed, the Fed really has been more concerned about wage pressures and asset price acceleration than commodity price pressures in recent months. These figures aren’t good enough to keep the gradualist policy of 25 basis point hikes in place for next week’s FOMC meeting. Retail sales moderate, but one month doesn’t a trend make
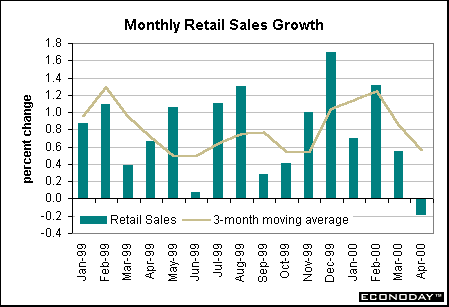
The chart above does suggest that retail sales are slowing down when one views the downward trend in the three month moving average over the past several months. Yet, it is worth pointing out that retail sales showed a similar pattern at the early part of last year as well. It also is worth mentioning that April retail sales may have been hurt by less-than-stellar seasonal adjustment factors. A late Easter and soggy weather conditions during the month may have curtailed spending. Moreover, some of the April declines were just a correction to strong March figures. For instance, sales at building materials and hardware stores fell 1.6 percent, but after a 4.8 percent hike in March we are still left with an average monthly gain of 1.6 percent over this two-month period. This hardly spells slowdown. Auto sales also fell for two straight months, but the February level of motor vehicle sales was at an all-time high. In the nondurable goods category, sales at gasoline service stations, reflecting a modest drop in gasoline prices, fell 2.3 percent in April but are still 23.2 percent higher than a year ago. Total retail sales excluding autos and gasoline inched up 0.2 percent in April. The bottom line on retail spending? The one-month drop in retail sales is hardly enough for Federal Reserve officials to believe that the consumer is ready to boycott the malls. Total retail sales surged at a whopping 13.7 percent annual rate in the first quarter – faster even than the first quarter of 1999. Coming from this torrid pace, a one-month pause isn’t sufficient to conclude that the five 25 basis point rate hikes the Fed has already undertaken is now curtailing consumer spending. Indeed, the preliminary data from the University of Michigan’s consumer sentiment survey showed that confidence strengthened in mid-May from already high March and April levels. Will the consumer ever take a more serious breather? It is possible. Freddie Mac announced that the average weekly 30-year mortgage rate jumped to 8.52 percent in the week ended May 12 from 8.28 percent in the first week of the month. If mortgage rates edge higher, this will eventually crimp home sales and spending on consumer durables. It will take more than a couple of months, though. THE
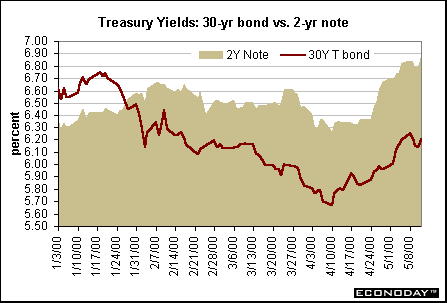
BOTTOM LINE Retail sales were weaker than expected by market players and this helped boost equity prices at the end of the week. Yet, viewed in a longer-term context, there was nothing in the retail sales report that suggested the consumer was in a new retrenching mode. It will take more than one month of soggy retail sales figures to convince policymakers that consumer demand may be slackening. After the April employment report, the majority of bond and stock investors became convinced that the Fed is now ready to lift the federal funds rate target by 50 basis points at the May 16 FOMC meeting. Until now, the Fed had taken a more gradual approach of increasing the funds rate by only 25 basis points at each meeting. While most market participants are convinced that a 50 basis point hike is in the offing for this coming meeting, the debate will soon shift to how much the Fed will be ready to raise rates (if at all) at the next FOMC meeting on June 28. Looking
Ahead: Week of May 15 to May 19 Monday Tuesday The market consensus shows housing starts should go up 2.9 percent in April to a 1.65 million unit rate after falling sharply in March. The level of housing construction would still be down from the first quarter average. Permits are expected to also post a modest gain to a 1.64 million unit rate for the month. Market players expect that the Fed will announce a 50 basis point hike in the federal funds rate at the end of the FOMC meeting. Thursday Economists are predicting the Philadelphia Fed Survey will rise to 16 in May from a level of 12.8 in April. This would reflect healthy manufacturing conditions in this Fed district. The federal budget should show a substantial surplus in April. Economists are predicting a surplus of $157 billion for this tax payment month. This would be a huge improvement from a year ago. Friday
|
|||||||||||||||||||||||||||||||||||||||||||||||||||||||||||||||||||||||||||||||||||||||||||||||||||||||||||||||||||||||


