|
 |
 |
Stocks defy jobs
Econoday Simply
Economics 5/8/00
By Evelina M. Tainer, Chief Economist |
Volatility is always
the name of the game
Stock prices sold off early in
the week as news of strong economic fundamentals spurred fears that
the Fed would become more aggressive in their near term rate hikes.
Prices fell sharply on Tuesday and Wednesday. According to market analysts,
the employment report was virtually ignored because stock investors
had already priced in a 50 basis point rate hike in their expectations.
But some market strategists felt this was a short-term phenomenon. Investors
appeared to focus on the fact that such robust economic data point to
improved corporate earnings no matter what interest rates do. Many expect
investors to re-think the situation in the coming week. In the meantime,
all major indices rose on Friday despite the robust employment report.
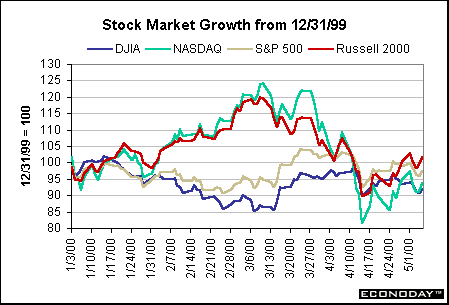
However, not all indices
posted gains for the week. Despite today’s favorable trading session,
the Dow, the NASDAQ composite and the S&P 500 all decreased from
week ago levels. The Russell 2000 is up from a week ago. The chart below
suggests that all the indices seem to be clustering around the same
spot. Actually, only the Russell 2000 is above 100 – which means it
is the only index that is higher from yearend. The S&P 500 is a
close second – and only 2.5 percent below yearend levels.
Economic
fundamentals: back in the saddle again
The Treasury market followed
the pattern set in the previous week. Strong economic data were uniformly
bearish for Treasury securities this week. Whether it was comments by
Federal Reserve officials or economic indicators, bond investors were
generally on the side of the bears. Economic indicators support the
view that Fed officials could easily decide to raise rates more aggressively
at the May 16 FOMC meeting. For the most part, investors are pricing
in such a hike. In fact, if the Fed were to only raise rates by 25 basis
points, bond investors would now worry that the Fed was behind the curve
and inflationary pressures might eventually get away from them. As soon
as the Fed announces a rate hike on the day of the FOMC meeting, market
players will start worrying about the next move.
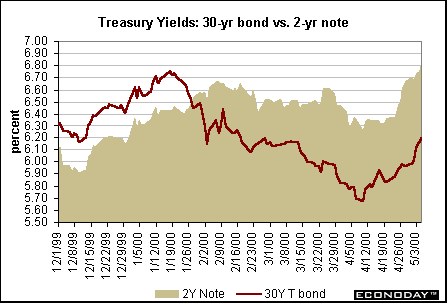
Notice in the table below
that the 10-year note and the 30-year bond yields increased more sharply
this week relative to the 2-year and 5-year notes. Last week, the reverse
happened with larger gains at the short end of the curve. This partly
reflects the issue of supply. Treasury officials announced borrowing
schedules, but just like early in the year, the official words coming
out of the Treasury weren’t consistent from one day to the next. Thus,
the 30-year bond yield rise partly reflects questions about the intended
supply of new 30-year bonds as well as buybacks of old bonds.
|
Markets at a Glance
|
| Treasury
Securities |
12/31/99
|
April
27
|
May
5
|
Weekly
Change
|
| 30-year Bond |
6.48%
|
5.96%
|
6.19%
|
+ 23 BP
|
| 10-year Note |
6.43%
|
6.22%
|
6.51%
|
+ 29 BP
|
| 5-year Note |
6.34%
|
6.54%
|
6.75%
|
+ 21 BP
|
| 2-year Note |
6.24%
|
6.67%
|
6.82%
|
+ 15 BP
|
| |
|
|
|
|
| Stock
Prices |
|
|
|
|
| DJIA |
11497*
|
10739*
|
10578*
|
- 1.0 %
|
| S&P 500 |
1469*
|
1452*
|
1433*
|
+ 1.2 %
|
| NASDAQ Composite |
4069*
|
3861*
|
3817*
|
+ 6.0 %
|
| Russell 2000 |
505*
|
506*
|
513*
|
+ 5.0 %
|
| |
|
|
|
|
| Exchange
Rates |
|
|
|
|
| Euro/$ |
1.0008
|
0.9121
|
0.8979
|
- 1.6 %
|
| Yen/$ |
102.40
|
108.18
|
108.33
|
+ 0.1%
|
| |
|
|
|
|
| Commodity
Prices |
|
|
|
|
| Crude Oil ($/barrel) |
$25.60
|
$25.70
|
$27.15
|
+ 5.6 %
|
| Gold ($/ounce) |
$289.60
|
$284.80
|
$280.40
|
- 1.5 %
|
(BP = basis points; stock price indices are rounded)
|
Robust
employment any way you slice it
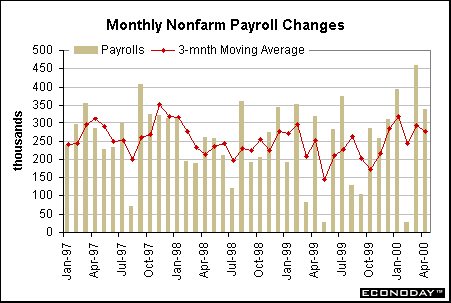
Nonfarm payroll employment jumped 340,000
in April after a 458,00 gain in March. Once-in-a-decade Census hiring
boosted both months. Even after taking into account this special factor,
there is no question that employment gains were still robust! Gains
were registered across the board with the exception of construction
payrolls, which likely corrected from a first-quarter spurt that was
caused by unseasonably warm weather. Some analysts pointed to the April
spurt in retail trade as a special factor, but retail trade employment
had been more modest in the past several months, possibly making this
a catch-up month. Even after searching for reasons to downplay the report,
one simply can’t make the case that employment growth is anything but
healthy.
Payroll data was not the
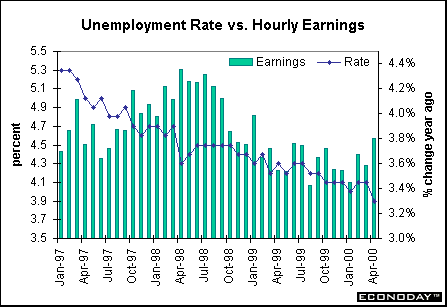
only series from this report that showed strength. The civilian unemployment
rate fell to 3.9 percent – the lowest rate since January 1970! Perhaps
even more disconcerting to Federal Reserve officials than a jobless
rate under 4 percent might be the sharp drop in the pool of available
workers, a series recently promoted by Alan Greenspan & company.
Though the series is only available back to 1993 on a monthly basis,
it goes back to 1970 on a quarterly basis. The April level is at its
lowest since the third quarter of 1974! Fed officials won’t take this
lightly.
Soon after the employment
situation was reported, President Clinton claimed that the employment
report was "wonderful news". No question that’s true from
a worker’s standpoint. Also good news for workers was a 0.4 percent
gain in average hourly earnings for the third time in four months. On
a year-over-year basis, hourly earnings rose 3.8 percent. But from the
standpoint of the Federal Reserve, they see increasing labor demand
coupled with declining resources and accelerating wages. Notice in the
chart above how hourly earnings are on a rising trajectory.
The bottom
line on employment? Every major
series coming from the employment report pointed to the same conclusion:
economic growth has strong momentum that hasn’t been stilled by five
25 basis point rate hikes in the past year. If wage pressures had not
accompanied employment demand, Federal Reserve officials would have
no business trying to cool down this red-hot economy. At it stands,
wages are accelerating on a monthly and yearly basis. The April employment
report makes a good case for more aggressive Fed action. Fed officials
may have spent some time debating the merits of a 50 basis point rate
hike at the last FOMC meeting; the debate may be more one-sided in favor
of 50 basis points at the May 16 meeting.
Productivity
moderates, but still shows good growth
Nonfarm productivity rose at
a 2.4 percent rate in the first quarter after growing at an average
6 percent rate in the second half of 1999. The first quarter pace seems
paltry in comparison, but is quite healthy from an historical perspective
– particularly at this late stage of an expansion. Moreover, on a year-over-year
basis, productivity increased 3.7 percent, the same as the fourth quarter
and the fastest rate since 1992. Market players were disappointed with
first quarter productivity figures only because they came in slightly
below expectations. Viewed in a broader perspective, the figures are
still robust.
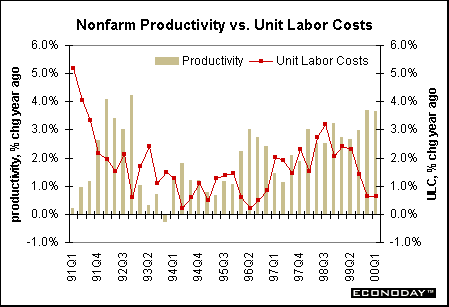
Unit labor costs in the
nonfarm sector rose at a 1.8 percent rate in the January to March period
after declining at a 2.9 percent rate in the previous quarter. Once
again, the figures are more sanguine when looking at the year-over-year
change, rising 0.7 percent in the first quarter. Note in the chart above
that unit labor costs are climbing at their slowest rate since mid-1996.
These are hardly cause for concern.
The bottom
line on productivity? From a long-term
historical perspective, the productivity and costs figures were actually
pretty favorable. However, there was nothing in the data to suggest
that the momentum on productivity and costs will be on the improving
side. While Greenspan & friends can’t deny that productivity growth
has exceeded expectations over this expansion, they can’t predict or
feel comfortable that the strong growth will continue. Moreover, Greenspan
is also worried that favorable productivity figures will get built in
to stock valuations which will in turn spur wealth and consumer demand.
All in all, the productivity data won’t be sufficient to maintain the
current gradualist approach to Fed rate hikes.
Bits
and pieces: the consumer
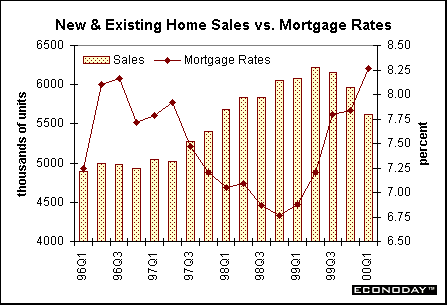
New home sales jumped 4.5 percent
in March to 966,000, the highest pace since November 1998. Despite the
boost, total sales (including existing) were down in the first quarter.
Indeed, the quarterly chart below shows a clear downward pattern of
housing activity since the peak in this cycle which occurred in the
second quarter of 1999. The chart also depicts the strong inverse correlation
between home sales and mortgage rates. The rising rates did slow down
housing activity, although perhaps not to the degree that economists
and policymakers would have expected based on historical trends. The
mortgage rate actually peaked in February at 8.31 percent and has since
fallen to 8.15 percent as of April.
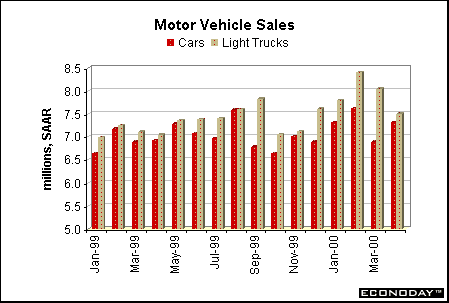
The other big-ticket item
purchased by consumers also moderated in April. Auto and truck sales
both peaked in February and have moderated since. However, as indicated
in the chart below, the level of motor vehicle sales are still high
relative to the past year. Fed officials would surely like to see a
more dramatic cooling off.
Bits
and pieces: manufacturing
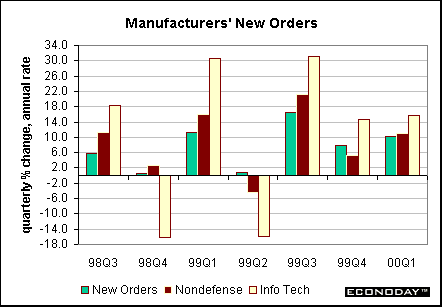
Factory orders jumped 2.2 percent
in March after decreasing the previous two months. New orders were generally
higher in the first quarter relative to the fourth quarter pace. The
key, though, is that the growth rate of factory orders has accelerated
the past two years; note the trend indicated in the chart below. The
NAPM survey edged down slightly in April, but remains well above the
50 percent mark. These two series both suggest that industrial production
could post healthy gains in the next few months. While the consumer
sector was booming in the past few years, manufacturing activity was
relatively anemic. The accelerated rate of growth bodes well for the
manufacturing sector, but this could be another source of anxiety for
the Fed. Incidentally, the accelerated wage gains in the past several
months are coming from manufacturing. Service-sector wages have remained
rather stable over the past six months.
THE
BOTTOM LINE
On the whole, this week’s set
of economic news was generally indicative of robust economic activity.
Few of the indicators showed significant moderation from the torrid
pace of the previous quarter. Even after accounting for Census hiring,
there is no question that the employment situation revealed very healthy
but tight labor market conditions. Wages are trending higher. Moreover,
the anecdotal evidence noted in the Beige Book was generally consistent
with the April employment report.
A few key indicators are
yet to be reported before the FOMC meeting. These include both of the
inflation measures (PPI and CPI) as well as retail sales and housing
starts. All will be quite important in helping Fed officials decide
how to proceed on cooling down the economy. At this point, bond and
stock investors are probably pricing in a rate hike of 50 basis points
for the May meeting. Whether the Fed will continue a more aggressive
policy in June and beyond has not been an issue yet for market players.
But as soon as the May 16 rate hike is announced, the question will
turn to the next FOMC meeting at the end of June.
Looking
Ahead: Week of May 8 to May 12
Market News International
compiles this market consensus which surveys about 20 economists each
week.
Thursday
Market participants are expecting new
jobless claims to decrease 18,000
in the week ended May 6 from last week's 303,000 level.
Economists are predicting
retail sales
will record a 0.4 percent gain in April after a modest 0.2 percent rise
in March. Excluding the volatile auto group, sales are also expected
to rise an anemic 0.4 percent gain. This reflects sluggish demand at
chain store sales.
Friday
The market consensus is looking for a drop of 0.3 percent in April’s
producer price index. The PPI is
now benefiting from a drop in energy prices. Remember, though, that
the PPI jumped 1 percent in each of the two previous months. Excluding
food and energy, economists are predicting a 0.1 percent gain in the
"core" PPI, the same as last month.
The market consensus shows
business inventories
rose 0.3 percent in March, less than the 0.5 percent gains of the two
previous months. This incorporates the flat inventory figure for manufacturing.
Week
of May 15 to May 19
Early forecasts show that industrial
production is expected to gain
0.8 percent in April after more anemic gains the past two months. This
incorporates the gain in factory payrolls coupled with a rise in the
average workweek. As a result, the capacity
utilization rate should rise to
81.8 percent, up 0.4 percentage points from the March.
As a preliminary look, economists
are expecting a 0.1 percent gain in the CPI
in April, much less than the 0.7 percent gain posted in March. Excluding
food and energy, the CPI should rise 0.2 percent – half as much as the
previous month.
|


