| |||||||||||||||||||||||||||||||||||


| Previous Articles |
|
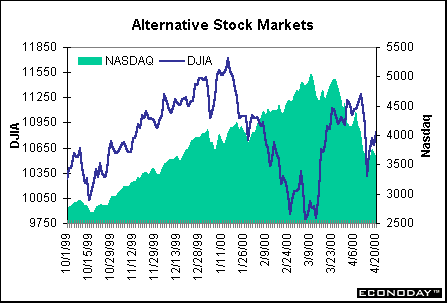
Its
a buying opportunity
The funniest part of the weeks recovery was that stock investors seemed to come to the conclusion that the March CPI was just a one-month fluke. We did see a similar spurt last year and it was eventually reversed. The CPI might indeed be a one-time event. However, the strong retail sales figures are part of a long trend. Both these figures are going to play big roles in determining the Feds decision to raise rates 25 or 50 basis points at the next FOMC meeting in mid-May. As a result, the markets dismissal of the CPI figures might be premature.
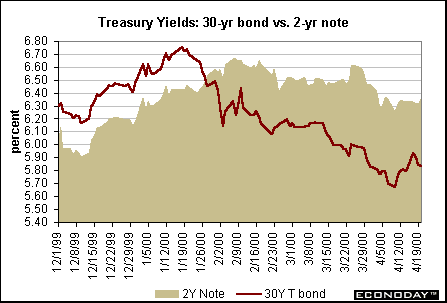
Treasury
market: is it stocks or buybacks?
Housing
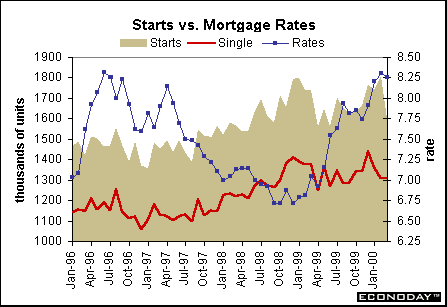
starts plunge, but will sector continue to soften?
As it turns out, new construction for multi-family units nose-dived 41 percent in March more than reversing the 30.5 percent spurt reported in February. Starts decreased primarily in the Northeast and Midwest regions of the country. These are regions often affected by unseasonable weather. Moreover, it is easy to get big movements in this sector if just a single large apartment complex goes up in the winter time. Construction of single family homes is less volatile over time and tends to be more sensitive to interest rate fluctuations. It also better reflects underlying consumer demand for new homes. Starts of single family homes remained unchanged in March from the February level. Both are down from the recent peak. Federal Reserve officials are quite concerned that current mortgage rate levels are not having much of a dampening effect on housing demand. Historically, interest rate hikes tend to curtail consumer spending first on such large ticket items as housing, furniture and autos. We havent seen anything yet. The bottom-line on housing? Perhaps the slowdown in housing activity that economists have been predicting for the past couple of years is finally beginning. However, given the sharp variability of weather conditions, which affect housing activity more dramatically during winter months, one shouldnt count on the March dip. Fed officials will be closely monitoring this data in coming months to see if mortgage rates will eventually curtail consumer demand. Trade
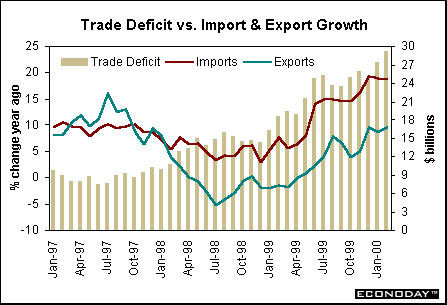
red ink widens
The bottom-line on foreign trade? The trade deficit widened because aircraft shipments from the U.S. fell off and oil imports surged. At least part of the rise in oil is due to higher prices. These two swing factors could shift direction in the next couple of months. That would boost total exports and at least moderate the growth in import demand. The foreign trade deficit is not easily diagnosed. In the old days one would abhor the deficit, buying goods and services from foreigners and keeping wages from U.S. workers. On the other hand, the ability of purchasing cheaper foreign goods helps to hold down inflationary pressures. Furthermore, the tight labor markets in the United States, coupled with strong aggregate demand, has generated an even greater need for imports to satisfy U.S. businesses and consumers. THE
BOTTOM LINE Last weeks market correction might have stalled the Feds policy actions in coming months. Certainly the CPI and retail sales figures favored a more aggressive approach to tightening (50 basis points rather than the normal 25 basis points increase on the federal funds rate). A market correction of the size we saw last week, if sustained, might have actually hampered consumer spending to some degree. And that would have reassured Fed officials. However, the reversal once again in stock prices suggests that the Fed cant count on weaker stock prices to curtail the euphoric consumer. They are likely to have to continue to raise rates in coming months. The size of the May 16 rate hike is still in question: will it be 25 basis points or 50? Looking
Ahead: Week of April 24 to April 28 Tuesday
Existing home sales are predicted to remain unchanged in March at a 4.75 million unit rate. Sales had jumped 6.7 percent in the previous month reflecting unseasonable weather conditions. Wednesday Thursday
Economists are predicting the employment cost index will rise 0.9 percent in the first quarter. Although this would be smaller than the fourth quarter gain of 1 percent, it represents an acceleration on a year over year basis from the 3.4 percent rate rise posted in the fourth quarter. The market consensus calls for real GDP to show it grew at a 6 percent rate in the first quarter, down only modestly from the 7.3 percent surge recorded in the final three months of last year. This reflects strength across the board, but particularly in personal consumption expenditures. The GDP chain price deflator is expected to rise at a 2.3 percent rate, up from a 2 percent rate in the previous quarter. This does incorporate higher energy prices for the period. Economists estimate that real final sales grew at a 6.9 percent rate in the first quarter, faster than the 6 percent rate posted in the fourth quarter of 1999. Friday
The market consensus is estimating that the Chicago purchasing managers index will edge down to 57 in April from a level of 57.4 in March. Despite the expected drop, the level still reflects healthy manufacturing activity. |
||||||||||||||||||||||||||||||||||||||||||||||||||||||||||||||||||||||||||||||||||||||||||||||||||||||||||||||||||