| |||||||||||||||||||||||||||||||||||
| Previous Articles |
|
Daily
averages mask week’s roller coaster
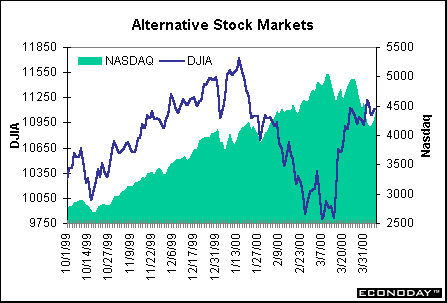
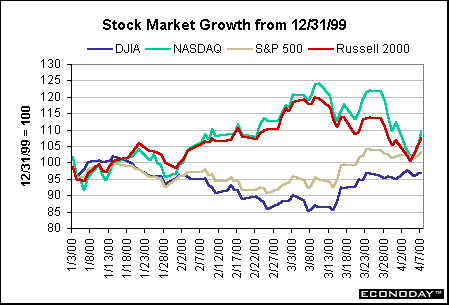
The dramatic backpedaling in the high tech sector led to some forward momentum in the old blue chips. The Dow surged early in the week moving exactly in the opposite direction of the NASDAQ. The plunge in the high tech sector coupled with a surge in the Dow on Monday helped to narrow the differential between these two indices that had widened to unprecedented levels in February and early March. During the rest of the week, the Dow patterned itself after the high tech index, even on Wild Tuesday when they both dropped more than 500 points only to claw their way back to more neutral territory.
The S&P 500 pretty much mirrored the Dow Jones Industrials this past week. It continues to outperform the Dow and remains above year ago levels. The Russell 2000, measuring the small cap sector, has moved in tandem with the NASDAQ composite index since many of the larger companies in the index are in the high tech sector.
Treasury
Rally across the curve - doesn't help mortgage market
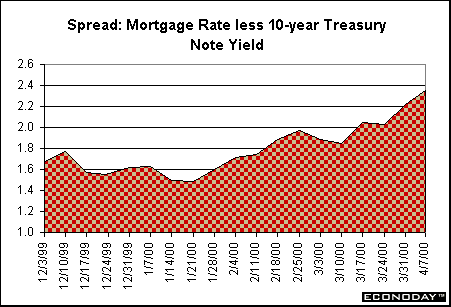
While Treasury securities are rallying in a big way, rates in the mortgage market have remained quite stable these past several weeks. In the past, mortgage rates have closely followed yields on 10-year Treasury notes. This relationship has deteriorated in the past two months when supply concerns hit the Treasury market. While this hurts consumers – and helps fatten profit margins for mortgage companies – it may relieve Fed officials that the Treasury isn’t undoing all its hard work of tightening credit conditions. Indeed, if mortgage rates were more in line with historical relationships to the Treasury yield, the Fed would probably have to raise rates by about 75 basis points more than it already has!
Payrolls
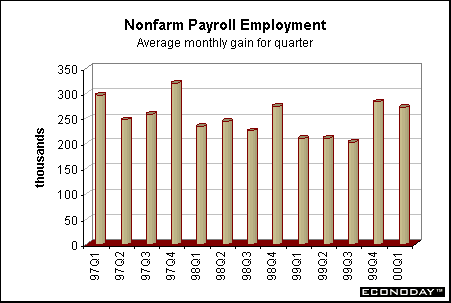
jump but underlying data reflect stability March also saw an unusual occurrence that tends to happen every 28 years on the calendar. Five weeks, rather than the normal four, elapsed between survey periods. This isn’t uncommon in other months of the year, but doesn’t typically happen between February and March. Normally, the Bureau of Labor Statistics is able to adjust for five-week survey periods based on historical patterns, but that wasn’t the case this month. As a result, the five-week survey period had the effect of boosting payrolls anywhere from 50,000 to 100,000 in the month. Finally, 15,000 Boeing workers returned to the job after being on strike last month. After all is said and done, it does appear that the robust gain of 416,000 is diminished by nearly 200,000 and brings the monthly payroll increase back in line with average gains. The chart below depicts average monthly gains on a quarterly basis over the past few years. Note that the first quarter average is nearly the same as the strong fourth quarter pace. Even though we can downplay the strength of the payroll numbers due to special factors, it doesn’t mean that economic activity won’t be robust for the period. While it may not necessarily lead to another real GDP growth rate of 7.3 percent, the first quarter growth will no doubt be in excess of the Fed’s preferred growth path of 3 to 3.5 percent.
The civilian unemployment rate remained unchanged in March at 4.1 percent. The household survey showed that both the labor force and measured employment declined for the month. While this is somewhat at odds with the payroll figures, it isn’t unusual to see such divergence from time to time. The pool of available workers – an indicator favored by Mr. Alan Greenspan himself – increased for the second straight month and now stands at the highest level since last August. This should reassure the Fed chairman that the labor supply is not diminishing at an accelerating rate.
Average hourly earnings rose 0.4 percent for the fourth straight month after posting smaller gains at the end of last year. This pushes up the year-over-year increase in earnings to 3.7 percent. While higher than the past few months, it is in line with increases seen since 1999 – and far from the peak reached in mid-1998. Nevertheless, Fed officials won’t like the growth path in wages even if it doesn’t necessarily reflect gains in excess of productivity. The bottom-line on employment? The employment report is not as robust as indicated by the monthly payroll figures. Yet special factors can’t be removed from economic data month after month. At some point, special factors do add up to real changes in activity. And despite such factors boosting employment data in the first quarter, there is no question that these will add to economic growth in terms of real GDP growth for the period. Federal Reserve officials attempt to adjust for special factors in making policy decisions. The March employment report is not likely to sway them to increase tightening measures. The gradual policy approach of raising the federal funds rate target by 25 basis point increments should remain intact over the next few months. THE
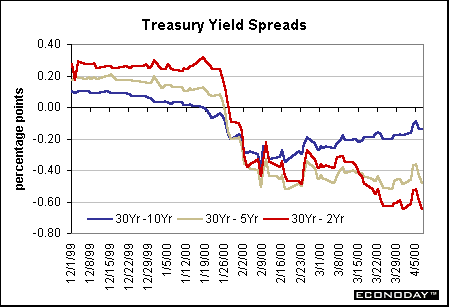
BOTTOM LINE In the bond market, investors also went on the same roller coaster as equities. Treasury securities are generally a safe-haven investment vehicle when uncertainty prevails. As investors dumped stocks during the week, Treasury securities benefited across the maturity spectrum. But the Treasury market is undergoing its own turmoil, feeling the impact of a diminishing borrowing schedule by the U.S. government. The employment report wasn’t the first indicator of the week, but it was probably the only indicator of any importance to financial market players. Despite strong headline numbers, underlying data seemed to indicate that economic activity and inflation did not accelerate in March. Based on the employment report, Fed officials are likely to continue their gradualist policy of raising the federal funds rate target by 25 basis points over the next couple of months. Looking
Ahead: Week of April 10 to April 14 Thursday The market consensus is looking for an increase of 0.5 percent in the PPI in March. In February, the PPI surged 1 percent. Higher energy prices will also contribute to the March PPI. Excluding food and energy, the PPI is expected to edge up a more modest 0.1 percent for the month, after gaining 0.3 percent in February. Economists are predicting retail sales to increase a meager 0.2 percent in March after recording a stronger 1.1 percent hike in February. Excluding autos, retail sales are expected to rise 0.6 percent. The more sluggish March pace in retail spending stems from the fact that Easter is relatively late this year and is hampering seasonal adjustment factors. Friday Economists expect business inventories to rise 0.5 percent in February after a 0.5 percent gain in January. This incorporates actual data for manufacturing and wholesale trade; only retail trade inventories are still unavailable. The index of industrial production is predicted to rise 0.2 percent in March, matching the February pace after more strength in January. This is based on the modest drop in factory payrolls. The capacity utilization rate should edge down to 81.6 from the previous month’s level of 81.7. |
|||||||||||||||||||||||||||||||||||||||||||||||||||||||||||||||||||||||||||||||||||||||||||||||||||||||||||||


