|

|
 |
GDP,
ECI Spell Trouble
Econoday Simply Economics
January 28, 2000
By Evelina M. Tainer, Chief
Economist |
New Data puts Question to
New Economy: Is Inflation a Threat?
Inflation fears
slam stock prices
On Monday
stock prices tumbled sharply, then drifted lower through the week, only
to plunge further on Friday. Inflation fears haunted market players
all week. Fed chairman Alan Greenspan was supposed to testify before
the Senate Budget Committee on Tuesday morning, but Washington D.C.
suffered a snow blowout. All government offices were closed on Tuesday
and Wednesday. Greenspan did testify before the Senate Banking Committee
on Wednesday afternoon, but everyone knew that would have to be a lovefest
given its nature – a reconfirmation hearing. Greenspan wasn’t about
to mention monetary policy then – and so close to the FOMC meeting anyway.
Market players were thus disappointed, at least at midweek, about the
lack of real news. Furthermore, the Labor Department had to postpone
the all-important employment cost index by a day. When GDP figures showed
a booming economy with accelerating inflation and the employment cost
index showed an upward drift in compensation costs, bond and stock prices
were bound to tumble.
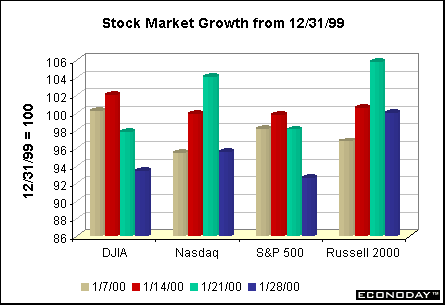
The most interesting part
of January’s market movement is that all major indices except the Russell
2000 are below year end levels. How ironic that only this small-cap
sector, which lagged far into 1999, would be the least to suffer in
the new year. But perhaps it reflects the fact that this is one sector
that wasn’t overbought last year. All those value investors in the small-cap
sector may now feel some relief.
Note of interest: The Dow Industrials are
at their lowest level since November 11, 1999; the S&P 500 is at
its lowest level since December 1, 1999; the Russell 2000 despite its
relative strength is at its lowest level since January 10, 2000; and
the Nasdaq composite stands at its lowest level since January 12, 2000.
Inverted
yield curve
Generally one can
talk about the direction of interest rates. Short term rates and long
term rates don’t always move by the same magnitude, but short term rates
are usually lower than long term rates and a normal yield curve has
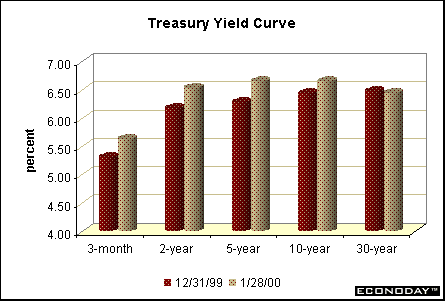
a positive slope. Life has changed these days. First of all, the yield
on the 30-year bond fell below the yield on the 10-year note last week.
Basically, the Treasury buyback program, which should begin within the
next couple of months, has caused a run-up in prices of 30-year bonds
– particularly off-the-run bonds (an off-the-run would be a 30-year
bond with a remaining maturity of 25 to 28 years for instance). The
increased demand for 30-year bonds comes from the fact that the upcoming
supply of these bonds will be reduced. As a result, this raises the
price and lowers the yield.
The inversion of the yield
curve reached new depths on Friday. Not only did interest yields surge
this morning on the bearish GDP and ECI reports, but technical players
in the hedge fund market seemed to create a variety of strange occurrences
in yield spreads -- between short and long term securities, between
short and intermediate securities, and between intermediate and long
term.
What’s the upshot of it
all? Basically, the yield on the 2-year note is higher than the yield
on the 30-year bond! Historically, an inverted yield curve like this
would be a sign that the economy was poised for slowdown – or even recession.
In this case, the 30-year bond yield is artificially depressed because
of changes in Treasury borrowing policy. It is certainly too soon to
tell, but the 10-year bond may become a more important benchmark going
forward.
To top off the insanity
in today’s markets, the tumble in the stock market caused some flight-to-quality
buying in the bond market as investors sold stocks for Treasuries. In
addition, the drop in the value of the euro (relative to the dollar)
added more foreign investors as well. (For more discussion on the euro,
see International Perspectives.)
Markets at a Glance
| Treasury Securities |
12/31/99 |
Jan 21 |
Jan 28 |
Weekly
Change
|
| 30-year Bond |
6.48% |
6.70% |
6.45% |
- 25 BP |
| 10-year Note |
6.43% |
6.77% |
6.65% |
-12 BP |
| 5-year Note |
6.34% |
6.63% |
6.65% |
+ 2 BP |
| 2-year Note |
6.24% |
6.46% |
6.54% |
+ 8 BP |
| Stock
Prices |
| DJIA |
11497* |
11252* |
10739* |
- 4.6% |
| S&P 500 |
1469* |
1441* |
1360* |
-5.6% |
| NASDAQ Composite |
4069* |
|
|
- 8.2% |
| Russell 2000 |
505* |
534* |
505* |
-5.4% |
| Exchange Rates |
|
|
|
|
| Euro/$ |
1.0008 |
1.0095 |
0.9754 |
- 3.4% |
| Yen/$ |
102.40 |
104.83 |
106.97 |
+ 2.0% |
| Commodity Prices |
|
|
|
|
| Crude Oil ($/barrel) |
$25.60 |
$28.20& |
$27.15 |
- 3.7% |
| Gold ($/ounce) |
$289.60 |
$289.80 |
$286.30 |
- 1.2% |
(BP = basis points; stock
price indices are rounded)
Employment
cost index disappoints
The employment
cost index rose 1.1 percent in the fourth quarter of 1999 after posting
a more moderate 0.8 percent gain in the three months ending September.
Wages and salaries grew 0.9 percent in both quarters, but the benefit
cost component jumped 1.3 percent in the year’s final quarter, much
more rapidly than the previous three quarters of the year.
The quarterly pattern of
changes in each of these components is quite jagged. The largest quarterly
gain for wages and salaries was posted in the second quarter, while
benefit costs grew most rapidly in the fourth quarter. Total compensation
increased more in the second and fourth quarters relative to the first
and third. This gives somewhat of a misleading picture of changing compensation
costs. As a result, it is more worthwhile to look at the 12-month change
in this series. In this case, the employment cost index rose 3.4 percent
in December relative to a year earlier – its largest gain since the
prior December. Total wages and salaries grew 3.5 percent in December
relative to last year, but posted a larger gain in June. The 3.3 percent
yearly rise in benefit costs was the largest in five years.
According to the Labor
Department, benefit costs were boosted primarily by three factors: Health
care costs accelerated; Sign-on bonuses picked up steam (perhaps in
lieu of higher wages); and employees benefited from more paid-leave
during the quarter.
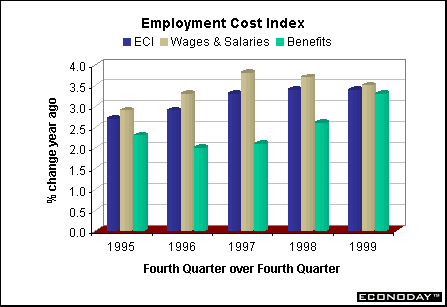
The yearly distribution
of the employment cost index shows somewhat of a different pattern than
the quarterly changes. The employment cost index rose 3.4 percent in
both 1998 and 1999. This is only marginally higher than the 3.3 percent
increase for 1997. Gains were at 3 percent or less from 1994 to 1996.
Wages and salaries peaked in 1997 with an annual gain of 3.8 percent,
but moderated in both 1998 and 1999 despite tight labor markets. Workers
may have opted to get better benefits packages. Indeed, benefit costs
bottomed out in 1996 with a 2 percent hike, and increased steadily through
1999 when they rose 3.3 percent. While sign-on bonuses and more paid-leave
are desirable outcomes for employees, one can’t say that the higher
health care costs are due to tight labor markets.
The bottom-line
on compensation costs? Even with
the recent uptick in the employment cost index and its components, there
is no question that the overall increases remained subdued despite a
period of healthy labor demand and a robust economy. In the past several
years, economists and policy-makers including the Federal Reserve Chairman
have pondered the question of the relatively undemanding labor force.
The tight labor markets – where the unemployment rate reached 4.1 percent
by the end of 1999 – surely should have caused employees to demand higher
wages. In the mid-1990s, Greenspan posited that workforce demands remained
quiescent because the downsizing of the early 1990s traumatized workers
and fears of layoffs kept workers in their place. Most economists who
study the process of inflationary pressures noted that higher wages
don’t necessarily create inflation. Perhaps workers didn’t demand wage
gains because consumer prices were subdued and they didn’t feel worse
off over time.
Though wage gains were
marginally higher and benefit costs jumped, these are still a small
portion of the employer’s compensation bill. Yet, policymakers at the
Federal Reserve will be able to point to the ECI as a good reason why
they need to raise rates at the February meeting next week. Some financial
market participants may wonder whether the Fed will immediately raise
the federal funds rate target by 50 basis points instead of the 25 basis
point incremental increases used in the past several years. It is more
likely that the Fed will institute more than one rate hike in rapid
succession than 50 points all at once. The next FOMC meeting is on March
21.
Red
hot economy
Real GDP expanded
at a whopping 5.8 percent rate in the fourth quarter just about the
same pace as the boiling third quarter. This just about matched the
5.9 percent rate recorded in 1998’s final quarter. As usual, the consumer
sector made a major contribution to this robust pace. Personal consumption
expenditures grew at a 5.3 percent rate, the fastest growth since the
first quarter. To add insult to injury, spending on durable goods zoomed
even after the Fed raised interest rates three times last year in order
to stem spending on interest-sensitive sectors.
Buy some interest-sensitive
sectors did stall. Residential investment expenditures fell 3.8 percent
in the third quarter and a further 1.2 percent in the fourth. This reflects
the slower pace of housing construction. Remember that "slower"
is a relative term, because the housing market is still booming by historical
standards.
Nonresidential investment
spending also decreased for the fourth straight quarter. Clearly, this
sector peaked even before the Fed began its round of credit tightening.
Yet, capital spending on equipment and software continued to grow, albeit
more slowly, in the fourth quarter.
Net exports deteriorated
further in the fourth quarter as the 10.6 percent rise in imports surpassed
the 6.9 percent gain in exports. Export demand picked up in 1999, though
after anemic demand the previous year. The drag from the foreign sector
was almost a blessing in disguise as import demand satisfied consumer
and business demands.
Government purchases on
consumption and investment surged at an 8.4 percent rate. Gains were
across the board, although federal defense expenditures posted strong
double-digit gains in both the third and fourth quarters. One has to
believe that a good portion of the government expenditures came in response
to the required compliance for Y2K.
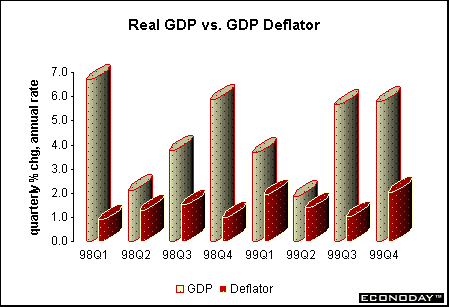
While Federal Reserve policymakers
have pretty much conceded that the economy can now grow faster than
"the old days" without generating inflationary pressures,
they are referring to a 3 percent pace – not twice that fast. Anxiety
over the fourth quarter growth rate had to be heightened by the 2 percent
rise in the GDP deflator. This matched the first quarter rate which
was also boosted by higher energy prices. But looking at the chart above,
it is evident that the quarterly growth in the deflator was higher in
1999 than in 1998.
The bottom-line
on economic activity? The economy
is sizzling, no doubt about it. Early last year economists were predicting
that inventory building would boost growth in the second half of the
year, but these inventories would be run down in early 2000 as Y2K worries
disappeared. But according to anecdotal evidence, inventory building
in the second half of 1999 was not due to worries about disruption coming
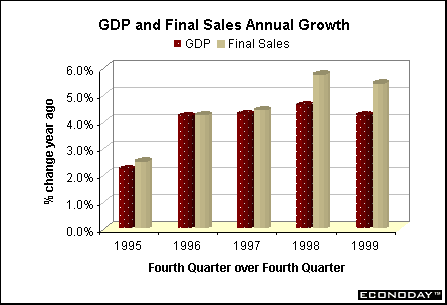
from Y2K. Moreover, final sales, a measure of domestic demand, grew
rapidly. The chart above shows growth in real GDP and real final sales
over the past five years on a fourth-to-fourth quarter basis. Notice
that final sales grew more rapidly than real GDP in both 1998 and 1999.
This is scary! It could mean that it will take a bigger push on the
part of the Fed to cool down this economy. (Read: higher interest rates)
Durable
goods point to increased production in first half of 2000
New
orders for manufacturers’ durable goods jumped 4.1 percent in December
after a more moderate 1 percent hike in November. The volatile transportation
(more specifically, aircraft) was largely behind the spurt. Excluding
transportation, orders rose a modest 0.7 percent in December, less than
the 2.5 percent gain recorded in the previous month.
It is useful to remove
aircraft orders from one month to the next in order to see the pattern
of the underlying durable goods data. However, aircraft orders are a
major source of production and should not be discounted entirely. On
a longer term basis, it is never a good idea to remove all the special
factors. After all, what’s left?
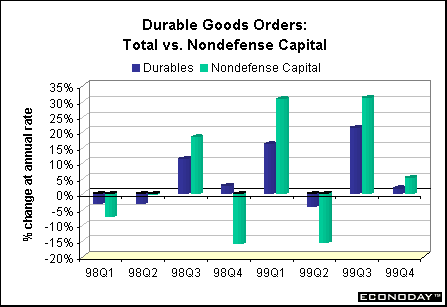
Despite the December spurt
in total new orders – and nondefense capital goods orders – the quarterly
growth in this sector was meager as indicated by the chart below. But
given the inherent volatility of durable goods, it is useful to take
a longer term perspective of the pattern set in the chart below. Notice
that the increases have outpaced the declines in the past eighteen months.
Moreover, given the pattern set below, one would have expected a drop
in orders in the fourth quarter. The fact that they rose even the slightest
bit reflects more inherent strength in the series.
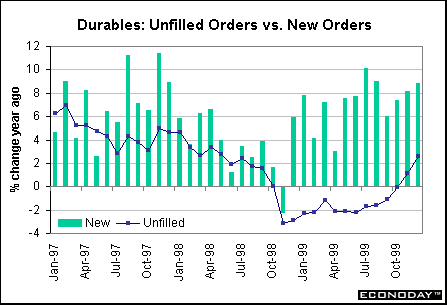
We like to look at unfilled
orders as well as new orders. This series is much less volatile on a
monthly basis – and also revised by smaller magnitudes. In essence,
the series gives a much better reading of future production schedules.
(By the way, Greenspan also prefers unfilled to new orders.) Note how
unfilled orders bottomed out in late 1998 and have steadily increased
in 1999. This upward trend certainly signals gains in production over
the next few months.
The bottom-line
on durable goods? Durable goods
are highly volatile, but longer term trends show that the manufacturing
sector is reflecting more strength, rather than less. The acceleration
in unfilled orders coupled with the overall gains in new orders point
to a pick up in industrial production in the next few months. This may
be another nail in the coffin for a succession of rate hikes beginning
next week.
The
Bottom Line
Snowstorms on the
east coast – and specifically Washington D.C. – set market participants
on edge this week. They cancelled an appearance by Greenspan and caused
government offices to close for two straight days. The employment cost
index was delayed until Friday and reported with the GDP figures instead
of a day earlier. Given that both figures were generally bearish with
respect to the financial markets, it makes one wonder whether the news
would have caused bond prices to drop more dramatically over a two-day
period than the impact on Friday on alone.
In any case, the week’s
data supports the view (already in the market for weeks) that the Fed
is likely to tighten monetary policy by raising the federal funds rate
target by 25 basis points. Most economists don’t believe that the data
warrant a 50 basis point hike immediately. But many expect that the
February rate hike could easily be followed by another 25 basis point
increase at the FOMC meeting on March 21.
One prominent Wall Street
economist suggested that the Fed might raise the discount rate by 25
basis points on February 2, in addition to the fed funds rate. The discount
rate used to be considered another method in which the Fed could tighten
policy. It offers little meaning these days. Some economists believe
that the Fed changes the discount rate with the fed funds rate when
they want to put an exclamation point on the deal. Whether they raise
the discount rate or not next Wednesday won’t change the impact of a
rate hike on consumers and businesses. Also, it won’t really reveal
whether the Fed will be inclined to augment rates in rapid succession
over the next few months.
Market participants will
be very anxious to see how the Fed uses its new announcement policy.
What statements will come forward with the announcement of the 25 basis
point hike? Will it be less obscure than the old bias? Only time will
tell.
Looking
Ahead: Week of January 31 to February 4
Market
News International compiles this
market consensus which surveys about 25 economists every week.
Monday
Market
players are looking for personal
income to post an increase of 0.4
percent for December. This would match the November gain and would reflect
the healthy showing in employment and earnings. At the same time, personal
consumption expenditures are expected
to jump 0.8 percent for the month. This would roughly double the November
growth rate.
The Chicago
Purchasing Managers’ index is expected
decrease in January to 55 percent from December’s level of 56 percent.
This still reflects healthy manufacturing activity in the Chicago region.
Market players will also keep a close watch on the prices paid component,
which stood at 67.7 in December.
Tuesday
The
market consensus points to a drop in the NAPM
Survey to 56.3 in January from
a level of 56.8 in December. Once again, market players will also look
closely at the prices paid component, which had edged up to 68.3 in
December.
Construction
expenditures are expected to remain
unchanged in December, following a 2.6 percent spurt in November. Nonresidential
construction expenditures are edging lower, but there is still life
in the residential housing market.
FOMC Meeting
– Day 1. No actions today.
Wednesday
The
market consensus shows the
index of leading indicators will
record a gain of 0.4 percent in December, a bit higher than the November
rise. This index reveals no pattern of uninterrupted growth in the economy.
FOMC Meeting
– Day 2. 25 basis point rate hike expected.
New home
sales are expected to rise 2.9
percent in December to a 890,000-unit rate. Sales had plunged 7.1 percent
in November offsetting an October spurt. On the whole, housing activity
moderated in the second half of 1999 relative to the first half of the
year.
Thursday
Market
participants are expecting new
jobless claims to increase 4,000
in the week ended January 29 from last week's 266,000. Claims fluctuate
more wildly during the holidays – and the holidays last through Presidents’
Day in February!
Factory
orders should record a gain of
2.5 percent in December after rising 1.2 percent in November. This incorporates
the 4.1 percent spurt in last week’s durable goods figures where a surge
in aircraft helped propel the total.
Friday
Economists
are predicting that nonfarm
payrolls will
rise 2505,000 in January, a solid pace but slower than the 315,000 gain
posted in December. The civilian
unemployment rate is expected to
come in 4 percent, a downtick of 0.1 percentage points from last month.
Average hourly earnings
should rise 0.3 percent, less than last month’s 0.4 percent hike. If
realized, it would mean a 3.1 percent year-over-year gain – down sharply
from last month’s 3.7 percent yearly rise. Finally, the average
workweek is expected to remain
unchanged at 34.5 hours.
|