| |||||||||||||||||||||||||||||||||||


| Previous Articles |
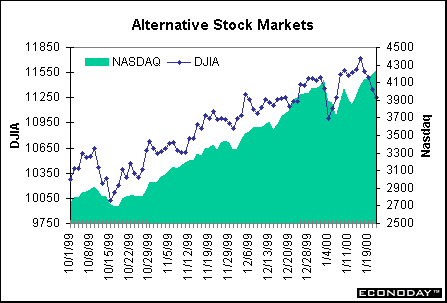
Blue chips down, tech stocks soar It wasnt a good week for the Dow Jones Industrial Average where prices tumbled all week. Earnings reports were out and were generally not all that bad. But the current fashionable response is to sell off on the stock when expectations are met. Rising interest rates certainly didnt help the major stocks, though technologies, improving markedly, were a notable exception. The NASDAQ composite regained all that it had lost and more ending the week on a new high.
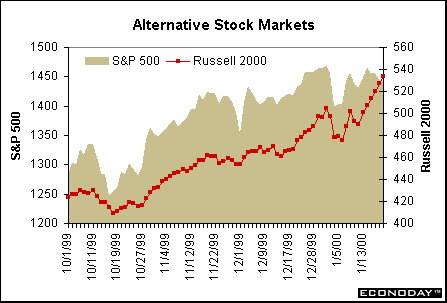
The S&P 500 and the Russell 2000 parted company this week. The Russell 2000 started a new growth path one that had been predicted for about two years at the end of 1999. It may still be too soon to call this a sustainable rise in the Russell, but analysts in the small-cap sector are hopeful. While much of the rise in the Russell could be attributed to tech stocks in December, gains are somewhat more broadbased in January. The Russell posted new records all week. In contrast, the S&P 500, like the Dow, stumbled this week.
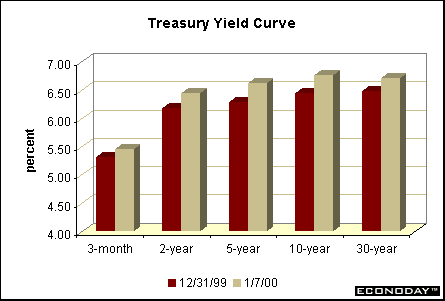
Yield curve inverts in US Treasury market Few economic figures were available to give the market any direction this week. And what was there wasnt all that different from previous weeks. Even the Beige Book reported the same old stuff. Fed officials crowded the news with their opinions, but like the data these werent all that different either. The major development in the bond market this week arose from last weeks Treasury announcement that it would buy back long-term bonds. But while this was holding down the yield on the 30-year bond, anxiety about Fed policy action caused the yield on the 10-year note to rise and overtake it. Some analysts are wondering if the inversion is really due to the lower supply of 30-year bonds or to technical factors that have boosted the yield on the 10-year.
Markets at a Glance
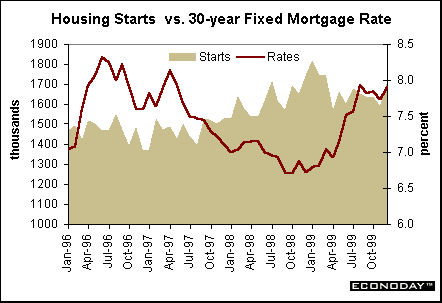
(BP = basis points; stock price indices are rounded) Fed "removes" bias, but doesnt create more transparent disclosure procedures Last August, the Fed established a working group in order to assess its approach to disclosing Federal Reserve policy after Federal Open Market Committee (FOMC) meetings. They announced this week that they would no longer indicate a "bias" towards easing or tightening. Rather, the new terminology will focus on the "FOMCs assessment of the risks to satisfactory economic performance " This means that, at each meeting, the Committee will reflect its view about economic conditions. The statement will include one of the bracketed set of words listed below. "Against the background of its long-run goals of price stability and sustainable economic growth and of the information currently available, the committee believes that the risks are [balanced with respect to prospects for both goals] [weighted mainly toward conditions that may generate heightened inflation pressures] [weighted mainly toward conditions that may generate economic weakness] in the foreseeable future." In reality, most economists who have spent their careers closely dissecting each and every word uttered by Fed officials dont believe that this new disclosure procedure is actually more transparent than the old. The old bias was essentially talking about balance of risks. This new method spells out the balance of risks a bit better but is still indicating a direction. The Fed only began to disclose its "bias" in May 1999, at which point market participants immediately took bias statements to indicate the Feds next move. When the Fed instituted a bias towards tightening, market players had generally believed that the Feds next move would be to raise rates. Fed Vice-Chairman Roger Ferguson had noted that a bias shift resulted in a rate move only about 50 percent of the time! It will be interesting to see how the Fed words its next communiqué. Financial market participants are expecting the Fed to raise the federal funds rate target by 25 basis points at the conclusion of the February 1 & 2 FOMC meeting. In the past, any time the Fed either raised or lowered rates, it would set its "bias" back to neutral. If it truly doesnt have a bias, the wording of the statement could leave an impression that the balance of risks still lean towards inflation. How real is housing boomlet in December? Housing starts jumped 7.1 percent in December to a 1.712 million-unit rate and their highest level since March. Starts of single-family homes, which are more sensitive to interest rate changes than multi-family construction, surged 7.9 percent in December. At a 1.402 million-unit rate, this was the highest level recorded since 1978!
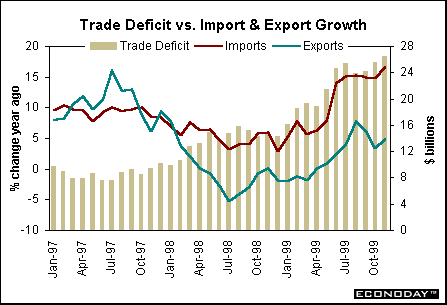
Financial market participants and Fed policy-makers would like to see some moderation in the pace of housing construction. After all, increases in interest rates are supposed to slow down the economy through the housing market and the subsequent reduction in demand for furniture and appliances as housing demand downshifts. The pick-up in December starts almost makes it appear as though the three rate hikes from 1999 were useless. Actually, it is worth noting that housing starts levels tend to be at their highest for the year during the winter months. In 1999, starts recorded their top levels in January, February, March, and December. In 1998, the December level of housing starts was the highest for the year. Given the unseasonably warm winters weve seen recently, it could very well be the case that the seasonal adjustment factors are doing a less-than-stellar job of adjusting monthly figures. Indeed, weather conditions were generally mild across the country this past December. The bottom-line on housing starts? December housing starts showed that the sector has strong signs of life in it still. Yet, the longer-term trend reveals that housing activity moderated in the second half of 1999 total starts were 2.4 percent lower on average from the first half of the year. In the first three weeks of 2000, the average rate on 30-year fixed rate mortgage loans is running at 8.20 percent, up 25 basis points from the December average. This is likely to dampen housing starts (and spending on consumer durable goods) going forward. Red ink on international trade deepens The international trade deficit on goods and services widened in November to $26.5 billion. While exports increased 0.7 percent for the month, imports rose twice as fast. Notice that import demand started to pick up again after a brief lull in mid-1999. Exports had moderated at the same time, but appear to be resuming their growth. As long as the U.S. economy grows at a more rapid clip than the rest of the world, it will be hard to stem the flow of red ink even if the foreign exchange value of the dollar depreciates.
The bottom-line on foreign trade? In the past couple of years, imports have satisfied consumer and business demands. Import growth fueled competitive pressures in the U.S and overall prices have remained relatively stable. Foreign economies are in much better shape these days and likely to demand more goods and services for their own constituents. This is what worries the Fed. Stronger global demand will make it more difficult for the U.S. to maintain stable prices. The Bottom Line Despite the sparse data week, housing starts did soar in December though such strong gains are always suspect in winter months. Market participants took heart from the less frothy permits figure. (We have found that housing permits are actually a poor leading indicator of housing starts. In fact, the figures often move in tandem and one-month divergences tend to recover very quickly.) The housing index compiled by the National Association of Home Builders for the month of January showed levels remain relatively high, but are down from about six months ago. This confirms the view that housing could be downshifting. The widening trade deficit is a drag on domestic growth and helps to dampen GDP growth. However, most economists are predicting fourth quarter real GDP expanded well in excess of 5 percent anyway. The Feds Beige Book, also reported this past week, did not seem to show any signs that the economy was pursuing new direction (of slower growth). Activity was robust, yet price pressures were generally subdued. This is the same pattern that the 12 Federal Reserve districts have shown throughout the year. Looking Ahead: Week of January 24 to January 28 We use the Market News Service survey of forecasts to describe the market consensus. Tuesday Market players are looking for the Conference Boards consumer confidence index to edge up in January to 142. In December, the index had risen to 141.4 reflecting optimism about the low inflation environment coupled with healthy labor market. In addition, stock prices grew smartly during the month, contributing to the euphoria. Existing home sales are expected to decline 0.2 percent in December to a 5.08 million-unit rate. Sales had surged to a 5.09 million-unit rate in November partly reflecting unseasonably warm weather conditions. This might carry over to December sales as well given the favorable weather during the month throughout most of the country. Thursday Market participants are expecting new jobless claims to increase 8,000 in the week ended January 22 from last week's 272,000. Claims fluctuate more wildly during the holidays and the holidays last through Presidents Day in February! The employment cost index is expected to record a gain of 0.9 percent in the October to December period. This would be a tad higher than the 0.8 percent gain posted in the third quarter. It would put the year-over-year gain at 3.3 percent, also a bit higher than the previous quarters 3.1 percent hike. While this is not a sharp acceleration, it would be the largest rise since the fourth quarter of 1998. Financial market participants are looking for a 1.0 percent increase in durable goods orders for December. New orders were virtually unchanged over the past couple of months, although manufacturing activity has been picking up in the past year. Friday Economists are predicting that real GDP will rise at a 5.3 percent rate in the fourth quarter, virtually the same red-hot pace as the previous quarter. A good portion of this gain is expected to come from inventory building. The consensus shows a 3.8 percent rate of growth in real final sales for the final quarter of the year. This is not showing the moderation that the Fed would like to see or that would encourage price stability and looser labor markets. Furthermore, the implicit price deflator is expected to rise at a 1.5 percent rate faster than the previous couple of quarters. This is at least partly due to rising energy prices. Week of January 31 February 4 An early look ahead to the employment situation shows that the consensus is predicting nonfarm payrolls to rise 235,000 in January less than the 315,000 recorded for December. At the same time, this group of economists expects the unemployment rate to edge down to 4 percent in January from 4.1 percent in December.
|
|||||||||||||||||||||||||||||||||||||||||||||||||||||||||||||||||||||||||||||||||||||||||||||||||||