 |
Irrational depression?
Equity investors are generally spooked by the month of October. While the historical record shows that other months could be just as mean, investors remember that market crashes have occurred in October on more than one occasion. As it turns out, November was also cruel to stock investors. Some analysts attribute the bearish sentiment to the uncertainty arising from the presidential election. Governor Bush was awarded the Florida electoral votes, but Vice President Gore is fighting back with all the legal measures available. Eventually, the United States will declare a President and a relief rally may ensue (or not).
This final week of November was beset by warnings of weaker-than-expected profits for the fourth quarter from retailers (Ann Taylor) as well as PC makers. It isn't surprising that equity investors worry about earnings results. But when one realizes that the earnings reports were still positive, just short of the high expectations, one begins to wonder whether the irrational exuberance of a few years ago is turning into irrational depression.
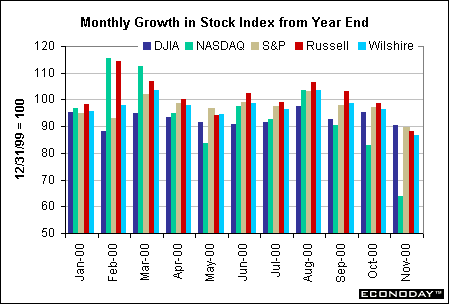
The chart above depicts the levels of the five major stock indices at the end of each month relative to the levels reached on December 31, 1999. The five different bars in the chart above are a bit awkward, but it is worth paying attention to the behavior of each and every stock index. Note that the NASDAQ composite index (green) has fallen the most this year. On November 30, the composite index was 36.2 percent below year-end levels. (Incidentally, the NASDAQ is down 48.5 percent from its peak reached on March 10.)
Until recently, the Russell 2000 index (of small capitalization stocks) was outperforming all the other key stock measures. As of the final day of November, the Russell fell into third place behind the Dow Jones Industrial Average and the S&P 500. It is also interesting to watch the pattern of movement in the various stock measures over the past year. Notice that "everyone" wanted to get out of old economy stocks and dissed the Dow Jones Industrials. However, by November 30, the DJIA was outperforming all the other measures. The S&P 500 is nearly in line with the Dow and has been relatively stable through most of the year (not showing sharp declines or gains). It is interesting, also, that a 10 percent decline for the year is the best that can be hoped for. On the surface, being down 10 percent is better than being down 35 percent! But it must be noted that over a two-year period the Dow is up 13.4 percent against the NASDAQ composite's 17.7 percent increase.
Flight to quality reduces treasury yields
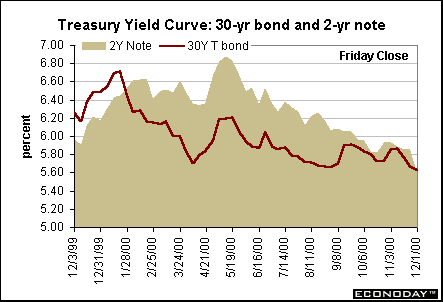
The Treasury securities market benefited by the dismal performance in the equity market this week. In a flight to quality bid, yields fell across the maturity spectrum this week. Yields on the 30-year bond were already off the past couple of weeks, but yields fell even more dramatically for the intermediate term issues. The yield on the 2-year Treasury note fell like a stone - down 26 basis points in just one week. In addition to flight to quality, bond investors are beginning to believe in Santa in the form of Alan Greenspan. Some analysts are talking about a Fed ease as early as the December 19 FOMC meeting. That is unlikely. But the Fed could certainly remove its inflation risk bias and move to neutral. If economic activity continues on its slower path, and inflationary pressures don't percolate, it is plausible to expect a Fed easing at the first FOMC meeting of 2001.
 |

Markets at a Glance • Recap of US Markets • The Economy • The Bottom Line • Looking Ahead
© Econoday, 2000. All Rights Reserved.
|
|

