
Manufacturing sector in decline
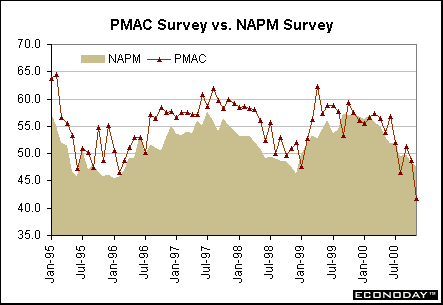
The Chicago purchasing managers' index spooked investors when the November index dropped seven points from the October level to 41.7. The index was below the 50 percent mark in three of the past four months. As depicted in the chart below, the NAPM survey closely mirrors changes in the Chicago index. Consequently, investors thought that the Chicago index was signaling a sharp drop in the nation's manufacturing activity as well. The NAPM survey dipped moderately in November to 47.7, a 0.5 percentage point drop from the previous month. While this still suggests that manufacturing activity is declining, it isn't as ominous as the Chicago index implied. But the chart clearly shows that Chicago index typically moves more dramatically than the NAPM in good times or in bad.
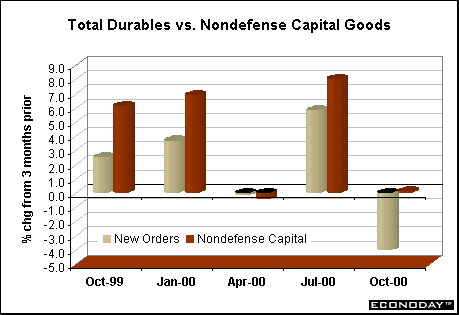
The advance durable goods report also indicated that manufacturing activity was downshifting. New orders for durable goods dropped 5.5 percent in October, just about reversing the gains of the previous two months. New orders for nondefense capital goods, considered a leading barometer of capital spending, declined 6 percent during the month. Comparing the level of new orders for the three months ending in October relative to the prior three months, the chart below shows a sharp deterioration over this period. This does suggest that industrial production is likely to moderate significantly in the next several months unless durable goods orders turnaround quickly and sharply.
Construction still healthy
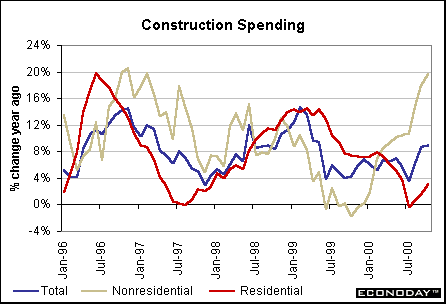
While manufacturing activity may be on the wane, construction spending is holding up remarkably well. Total construction expenditures increased 0.9 percent in October, slower than the past few months, but the third straight monthly rise after a couple of declines during the summer months. Housing starts have stabilized in the past few months although they were drifting lower through much of the early part of the year. This translated into sharp declines in residential construction spending. In the past few months, spending on residential buildings turned up again, albeit at a moderate pace.
In sharp contrast, spending on nonresidential construction is booming. Gains are solid month after month. As a result, expenditures are up a whopping 19.6 percent from last October. The chart below depicts the large variation in spending between these two main sectors. The trend follows historical patterns - shifting from residential to nonresidential spending. The two don't tend to move in tandem.
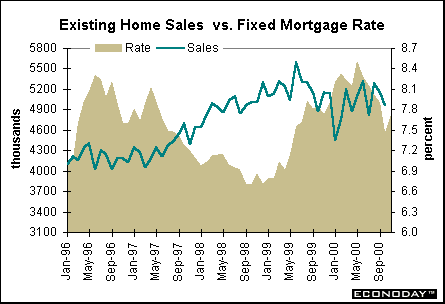
The sluggish residential construction pattern is exhibited in other data as well. Sales of existing single-family homes declined 3.9 percent in October to a 4.96 million-unit rate after declining 2.3 percent in September. Sales are only 1.6 percent higher than year ago levels and are well below the peak, recorded in early 1999. Sales remain healthy given a longer historical context, but appear "sluggish" after the strong activity of the past few years. Sales do appear to have stabilized despite downward trends in mortgage rates. It appears that consumers are also considering other factors such as income growth and a "negative wealth effect" as equity prices have dropped like a stone in the past several months.
Real GDP revised down marginally
The Commerce Department's revised estimates show that real GDP grew at a 2.4 percent rate in the third quarter, less than half the rate posted in either the first or second quarters of the year. After the pace of the previous four quarters, the July to September growth rate appears downright anemic! Given the new math, the third quarter growth was even less than the long-term sustainable and acceptable trend (by Federal Reserve officials) of 3 to 3.5 percent.
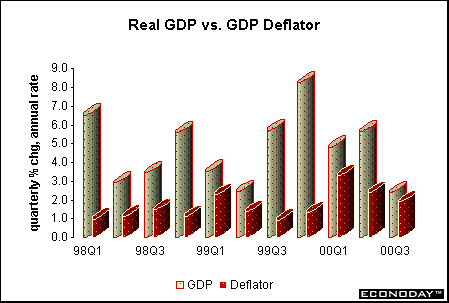
Personal consumption expenditures continued their march with a 4.5 percent rate of growth spurred by gains in durable goods, but nearly as strong in nondurable goods and services as well. Business fixed investment was revised higher for the period, expanding at a 7.8 percent rate. In contrast to previous periods, the growth came in nonresidential investment (+14.9 percent) rather than in equipment and software expenditures (+5.8 percent). Inventory investment was robust, but down marginally from the second quarter pace. The major drag on growth (surprise, surprise) was net exports, which widened by $22 billion in real terms. Exports did manage a healthy 15.4 percent gain, but imports surged 17.4 percent.
As real GDP growth shifts down, and the GDP deflator continues to increase at roughly the same rate (1.9 percent in the third quarter), it means that nominal GDP is expanding less rapidly as well. As a result, corporate profits are bound to grow more slowly. On a quarterly basis, after-tax profits were up a measly 0.6 percent from the second quarter. The showing is somewhat better on a year-over-year basis (which is more reliable for this highly volatile figure). After-tax corporate profits rose 15.8 percent in the third quarter, roughly the same pace as the first quarter, but less than the April to June period. Investors figure (correctly) that the slower pace of GDP growth will yield softer profit gains going forward.
GDP data is generally old news, but sometimes trends in various components will give a hint about the future. The third quarter data do suggest that production is likely to moderate in coming months given that inventory investment was robust for two straight quarters, but real final sales moderated during the same time period. Manufacturers' and retailers' may want to scale down on inventories in coming months if final demand is softer than it was a year ago.
Personal spending began the quarter on a weak note. Anecdotal evidence is pointing to a less than stellar holiday season for retailers, while consumption expenditures edged up a modest 0.2 percent in October after 0.7 percent gains in the third quarter. Consumer spending is drifting lower on a year-over-year basis as well, as indicated in the chart below.
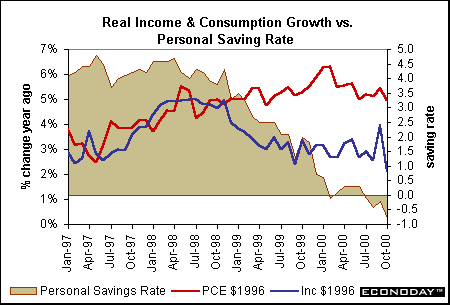
The wide gap between spending and income is not narrowing, though. Personal income fell 0.2 percent in October after surging 1.1 percent in September. The wide swing in both months is due to a boost in farm subsidy payments in September followed by a drop in subsidy payments in October. After removing for this special factor, personal income growth remained near its average pace of the past several months. In the meantime, though, the personal savings rate fell further into the red and now stands at -0.8 percent in October. The personal savings rate is simply a residual figure in this report and is not considered accurate or an actual measure of savings held by individuals. However, the trend in the series is disturbing. Just one year ago, the savings rate was 2 percent and two years ago (October 1998) the savings rate stood at 3.8 percent. Should a sudden downturn cause consumers to lose their jobs, they wouldn't have much of a cushion (particularly now that wealth from stock prices has eroded).
 |

Markets at a Glance • Recap of US Markets • The Economy • The Bottom Line • Looking Ahead
© Econoday, 2000. All Rights Reserved.
|

