
Housing drop doesn't change story: this sector is still hot
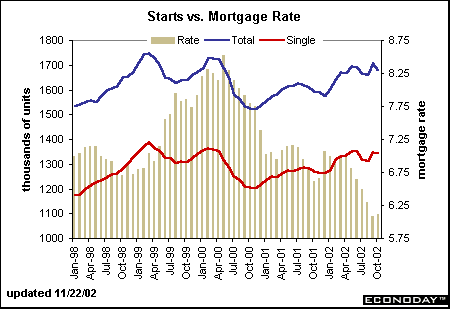
Housing starts plunged 11.4 percent in October to a 1.603 million-unit rate after surging by a similar amount in September to a 1.810 million-unit rate. Despite the drop, October starts are still 4.7 percent above year ago levels. The headline figure masked underlying strength. Starts of single-family homes declined only 7 percent in October, not nearly reversing September's whopping gain of 16.3 percent. The bulk of the October decline was due to a plunge in the multi-family sector, which fluctuates sharply from one month to the next.
The chart below shows a 5-month moving average of total starts and single family starts. According to the Census Bureau, it takes five months to establish a trend in this series. Overall trends are still very healthy. Notice that the upward climb in housing activity has been somewhat moderate in the past couple of years though mortgage rates have declined more than 200 basis points. It suggests that the strength of the housing market in 1999 and 2000 probably stemmed from healthy income growth and stock market gains, which at the time offset the negative impact of higher mortgage rates. Right now, the stock market and income growth are not the major supports they once were for the housing sector. However, the lower mortgage rates have helped to spur activity in the past 12 months in particular.
Manufacturing revival?
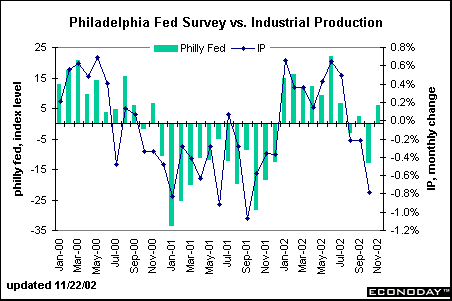
It is too soon to make a convincing argument that the manufacturing sector is beginning to revive. Nevertheless, the Philadelphia Fed's business outlook survey showed promising trends in November. The general business conditions index, depicted below in a comparison to the industrial production index, recorded a level of 6.1 in November, up sharply from a -13.1 level in October. The past four months have seen a sawtooth pattern, so it is too soon to tell whether a sustained upward trend is in the works. New orders and shipments were both up in November after declining last month. Delivery time, unfilled orders and inventories remained in negative territory. Given the strong correlation between the Philadelphia Fed's index and industrial production, it is a good bet that industrial production will show better results in November than in the previous three months.
International trade picture not pretty
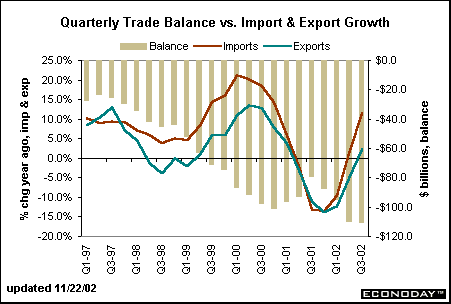
The international trade balance on goods and services was little changed in September from the previous month and amounted to a shortfall of $38.0 billion. Both imports and exports posted slight declines for the month. The West Coast dockworkers lockout impacted the monthly figures and is likely to affect them even more dramatically in October. The chart below shows the quarterly path of trade over the past five years, including yearly growth for imports and exports. After five quarters of year-over-year declines, both imports and exports rose in the third quarter. The improving trend over the past few quarters does confirm economic recovery, albeit a meager one.
Our annual trade patterns are changing somewhat from the past couple of years. The chart below shows the U.S. bilateral trade deficits with our major trading partners comparing the year-to-date (through September) patterns since 2000. The trade deficit with Canada is on par with that established in 2000, and slightly lower than the 2001 deficit. In contrast, the trade deficit with Mexico is higher in both 2001 and 2002. The gap between the United States and Western Europe has increased sharply in 2002, perhaps indicating that the economic recovery in Europe is even more meager than the U.S. recovery.
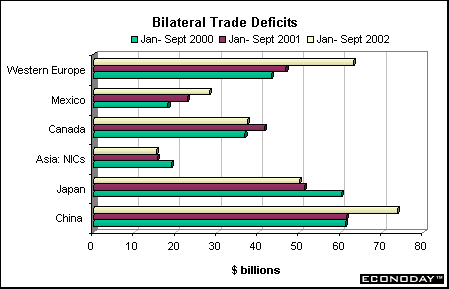
Across the Pacific, the picture changes slightly. The U.S bilateral trade deficit with Japan and Asian NICs (newly industrialized countries) are virtually unchanged in 2002 to 2001. In both cases, the trade deficits are somewhat smaller than in 2000. However, the trade deficit with China is growing in 2002 after remaining unchanged in 2001 over 2000 levels. The shift from Japan and Asian NICs towards greater imbalance with China reflects the fact that this is the geographic area with the lowest cost production.
Fiscal year starts deeply in the red
The Treasury announced that the budget deficit amounted to $54 billion in October, the largest monthly deficit ever recorded for that particular month. It is a far cry from the modest deficits recorded for the month in the previous two years (the two smallest deficits for this month over the past 15 years). Income tax receipts were down 13 percent relative to a year ago; corporate income tax receipts were negative (tax credits) compared with healthy receipts last October. Total receipts were down 20.5 percent this October, the first month of the 2003 fiscal year, relative to last October. On the spending side, net interest payments were down 10 percent, but defense expenditures were 15.2 percent higher than a year ago and Medicare spending was up a whopping 26.3 percent relative to last October. It is an understatement to say that we are starting out the fiscal year on a bad note.
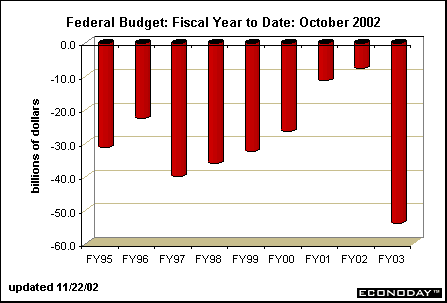
Private economists are looking for a fairly sizable budget deficit this year. The economic recovery is anemic and there is a strong possibility that the U.S will go to war with Iraq. Two prominent economists who closely monitor fiscal policy and their impact on budget matters have indicated that the fiscal year deficit could amount to $200 billion even without war - and possibly as high as $300 billion. We saw a $200 billion deficit in 1994 and a $290 shortfall in 1992.
Large budget deficits should lead to increased borrowing by the Treasury. The old economic argument, which many were dismissing in the 1980s, was that hefty government borrowing would crowd out private sector borrowing and investment because interest rates would rise as the U.S. Treasury sold more and more securities. Indeed, many bond investors have already suggested that the Treasury bring back the old 30-year bond, whose issuance was suspended just one year ago in October 2001. There is no question that the Treasury will eventually need to increase issuance of short term bills, notes and bonds in order to meet their borrowing needs. Typically, increased supply of Treasury securities leads to higher yields on Treasury securities. There is no way around this phenomenon.


Markets at a Glance • Recap of US Markets • The Economy • The Bottom Line • Looking Ahead
|