
PPI whopper not likely to be repeated
The producer price index jumped 1.1 percent in October after posting several months of declines or very modest gains. The PPI last recorded such a large gain in January 2001. The October spurt was a confluence of special factors. Food prices rose 0.7 percent (fruits and vegetables and port prices skyrocketed) after declining for the three previous months. Energy prices shot up 4.2 percent in October after smaller, although not insignificant, gains in previous months. Gasoline prices soared a whopping 17.9 percent in October! Food and energy prices are often volatile. That's why economists and market players have learned to closely monitor the PPI excluding food and energy prices.
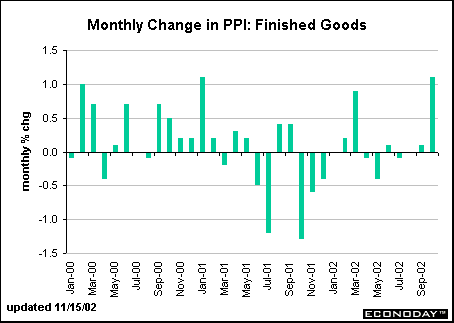
The core PPI, excluding food and energy, jumped 0.5 percent in October, its largest monthly gain since September 1999. Drug prices, though relatively tame for the past twelve months, increased 1 percent in October. Apparel prices also increased in October after barely edging up all year. At the same time, car prices gained 2.2 percent and light truck prices rose 1.9 percent. September and October tend to be funky months for measuring motor vehicle prices. In October, new model year vehicles are factored into the PPI (as well as the CPI) and tend to lift the index. September rebates are also no longer in effect. When special rebates and zero percent financing eventually end, this will tend to boost the PPI in the future. In the meantime, Labor Department officials don't expect the October gain to be repeated any time soon.
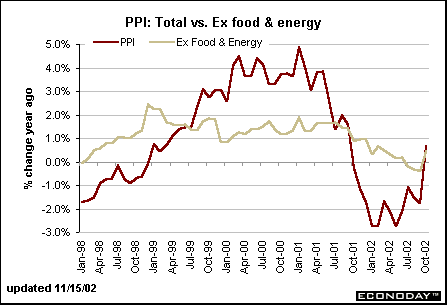
The October spurt in the PPI boosted both the total index and the core PPI on a year-over-year basis. The total PPI is up 0.6 percent from last October; the PPI excluding food and energy prices is 0.5 percent higher than a year ago.
Production falters
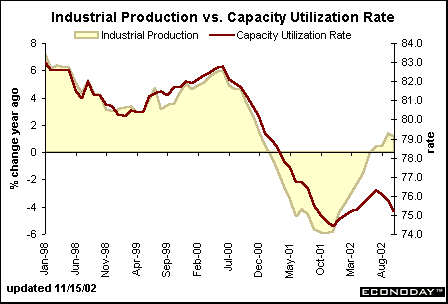
The index of industrial production fell 0.8 percent in October after posting more modest 0.2 percent declines in each of the two previous months. According to the report, utilities and mining were hit by storm-related disruptions. To a lesser degree, production was also hurt by the West Coast dockworkers lockout. The drop in production led to a decline in the capacity utilization rate to 75.2 in October from 75.8. When the capacity utilization rate is declining, there is no cause for concern for supply bottlenecks and inflationary pressures. The flip side is that producers don't need to increase capital spending.
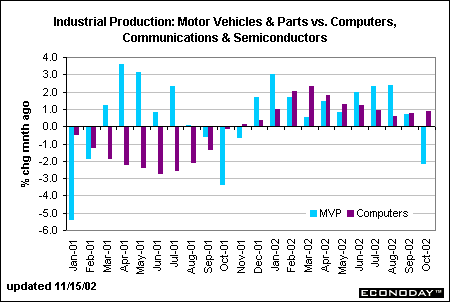
Total motor vehicle assemblies dropped 5.2 percent during the month, but declines were widespread across the manufacturing sector. High-tech industries managed to post a modest 0.5 percent rise after increasing 1.4 percent in September. The chart below shows that the high-tech sector has managed to increase steadily over the past 12 months. The decline in motor vehicle production in October was only the sixth in two years.
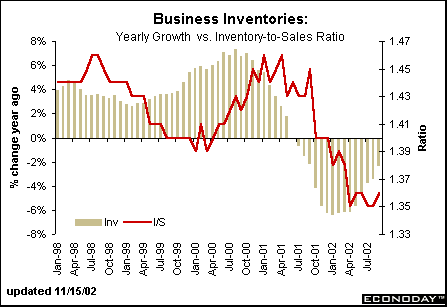
There is no question that the industrial sector has hit a soft-patch. A rebound in production would go a long way in boosting GDP growth and the economic recovery. Business inventories are lagged a month behind the production data but are showing signs of improvement. Business inventories rose 0.5 percent in September, allowing the year-over-year decline to narrow from the previous month. Inventory building should help boost production if producers believe that demand will eventually perk up. As indicated in the chart, the inventory-to-sales ratio is bumping along at historically low levels. Even with just-in-time inventory trends, the current ratio suggests that gains should take place in upcoming months.
Retail sales: upside surprise
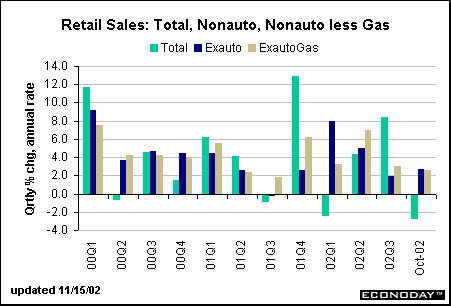
Retail sales were unchanged in October after declining 1.3 percent in September. The bulk of the two-month weakness stems from declines in motor vehicle sales in those two months. Excluding autos, retail sales gained 0.7 percent in October, a vast improvement after the average monthly gain of 0.1 percent per month in the July-to-September period. The chart below compares the October data relative to the third quarter average. A plunge in motor vehicle sales indicates that total retail sales are down from the previous quarter. However, non-auto retail sales are holding up pretty well compared to last quarter. These figures do reflect only one month of the quarter's data and the picture can certainly change if holiday sales are sluggish in November and December. While retail sales are adjusted for seasonal variation including selling days, the seasonal adjustment process is not perfect; there are fewer days between Thanksgiving and Christmas this year, which could hurt spending.
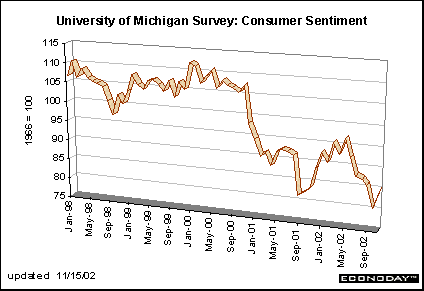
We all know that consumer sentiment doesn't always predict consumer spending behavior. But market players and economists breathed a sigh of relief when the University of Michigan's consumer sentiment index increased for early November. This bodes well, at least psychologically, for holiday retail sales.

Markets at a Glance • Recap of US Markets • The Economy • The Bottom Line • Looking Ahead
|

