 |

No matter the chart, retail sales are anemic
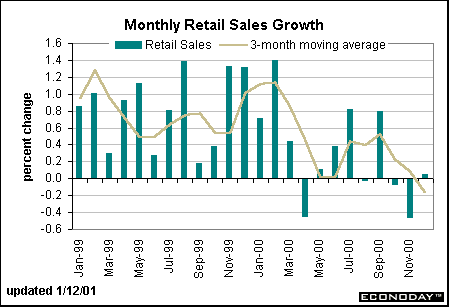
Retail sales edged up 0.1 percent in December after dropping 0.5 percent in November and dipping 0.1 percent in October. The December uptick was a bit of a surprise in light of the sharp drop in unit sales of autos and light trucks for the month. Indeed, the retail sales figures showed that the auto group inched up 0.3 percent in December in sharp contrast to expectations. From time to time, the unit motor vehicle sales figures will not match up with the retail sales version that reflects total value of car and truck sales (price times quantity). Economists and Fed policymakers consider unit sales more reliable than the retail sales version. Excluding the auto group, retail sales were unchanged for the month after a 0.2 percent dip in November. No question about it, all the anecdotal evidence seemed to carry through. The holiday season was a bust for retailers in general. The chart of monthly retail sales below reveals that consumer spending virtually came to a standstill in the fourth quarter.

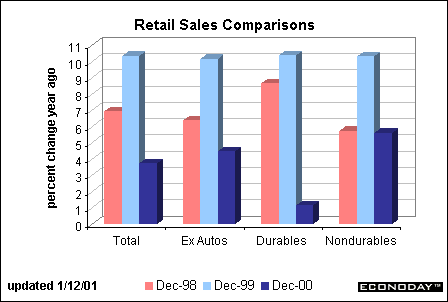
Retailers like to compare sales on a year-over-year basis. The chart below shows the yearly change in each of the past three Decembers. Clearly, 1999 was an excellent year for durable and nondurable goods stores alike! The year 2000 brought fewer durable sales. It is important to keep in mind that 1999 was a boom year as consumers bought all sorts of things in anticipation of the millennium celebration. And who could resist all those purchases a year ago when the Nasdaq composite was running in excess of 80 percent for the year! All in all, total retail sales were up 3.7 percent in 2000 after jumping 10.3 percent in 1999. This could be called a respectable gain by historical standards, if not by recent standards.

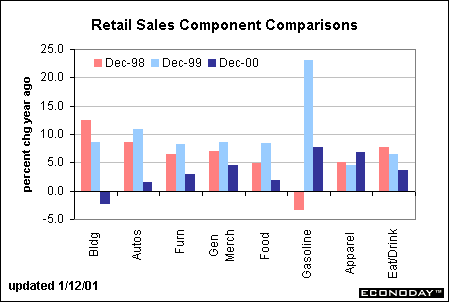
Fast forward to 2000 and the consumer sector was clearly more cautious. It didn't help that the Nasdaq plunged 39 percent during the year, dampening consumer spending. The chart below shows how the various components of retail sales fared last year. The strongest growth was posted at gasoline service stations. Unfortunately, that was probably due to higher gas prices rather than higher volumes for gas station owners. Apparel stores, though, rose nearly as much as gas stations. Inflationary pressures were not running in high gear in this sector, suggesting that apparel and accessory stores performed relatively well in volume terms. Department store sales (the major component of general merchandise) were decent, even though they were less than the previous two years. Eating and drinking places also did pretty well when one considers that 1998 and 1999 posted healthy gains as well.

Consumer spending has moderated. Bond market players would have preferred to see weaker sales in order to prompt easier Fed policy. But the data are sufficiently anemic to keep the Fed in its new policy track.


Markets at a Glance • Recap of US Markets • The Economy • The Bottom Line • Looking Ahead
© Econoday, 2000. All Rights Reserved.
|
 |