
Housing starts decline meager in face of July stock market collapse
Housing starts fell 2.7 percent in July, matching the June drop. Keep in mind, however, that the May construction rate was the strongest since January 2000. Thus, the June-July drop can hardly be classified as a sign of weakness. The Census Bureau, which compiles the figures, believes that calculating and analyzing the five-month moving average of the series, rather than looking at the raw monthly figures, should smooth the inherent volatility. The chart below depicts the 5-month moving average for total and single family starts. Notice that starts are well above year-ago levels (+2.3 percent for total, +3.5 percent for single family).
According to conventional wisdom, housing starts are extremely sensitive to interest rate changes so that a decline in rates will lead to a rise in starts and vice versa. Actually, this chart reveals that the reaction time between rising or falling rates and housing construction is more than a couple of months. For instance, housing starts began in fall in 2000 at the same time that interest rates were falling. Most likely, this was a reaction to the rising rate environment of 1999. Rates continued to drop during most of the past two years and this allowed housing starts to generally post gains during this period. Since July 2001, housing starts have consistently posted year-over-year gains when using the 5-month moving average series (rather than the raw monthly data).
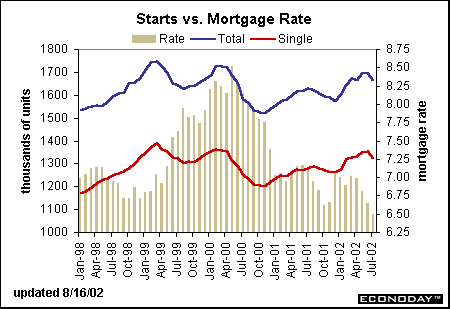
Interest rates on 30-year mortgage loans averaged 6.49 percent in July. The latest figures for the week ended Aug. 16 averaged 6.22 percent - the lowest level since Freddie Mac began maintaining these statistics 32 years ago. Lower interest rates bring in new buyers to the market because monthly mortgage payments become more affordable. Home prices have risen lately, but lending rules have been relaxed so that a 20-percent or even 10-percent down payment is no longer required in many cases. The lower rates may increase the demand for new starter homes for lower income families.
Retail sales: strong and weak
Retail sales jumped 1.2 percent in July after a 1.4 percent spurt in June. However, excluding motor vehicles, retail sales rose 0.2 percent, less than June's 0.5 percent gain. The July picture looks even worse after excluding gas station sales, which tend to be overwhelmed by gas price changes rather than volume changes. If it weren't for a burst in auto and truck sales, the July retail sales figures would look pretty anemic. The chart below compares quarterly retail sales at annual rates (with July's sales compared against the second-quarter average.) Total sales accelerated - due primarily to a boost in motor vehicles. Sales for nonauto goods were pretty soggy. Unless sales pick up in August and September, the third quarter could turn out to be the weakest since the third quarter a year ago.
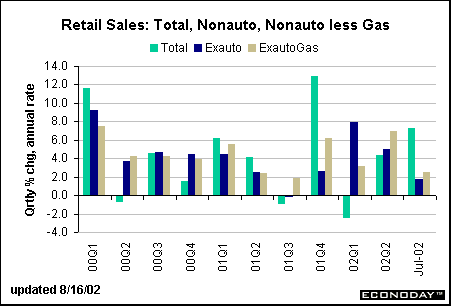
Typically, we like to see retail sales rise across the board. Look at the quarterly patterns in 2000 and early 2001 - for the most part gains were similar whether looking at the total or the nonauto component. In recent quarters, consumers have made decisions to either buy cars or to buy other goods. This indicates that consumers are definitely more cautious these days, not spending their hard-earned cash at both the mall and the car-lot at once. Consumers are monitoring their expenditures hoping to get the best value for their dollars.
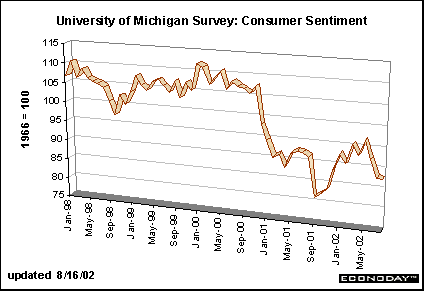
The early data on the University of Michigan's consumer sentiment index showed hardly any change in the first half of August (87.9) from the July average (88.1). The market consensus had called for a slight gain - perhaps since stock prices have started to recover in the past few weeks. It is still possible that the month-end figures will look better. Consumer spending and sentiment are tied together in the long run, but a monthly change in this index does not correlate to any particular spending pattern for retail sales.
Production growth slows
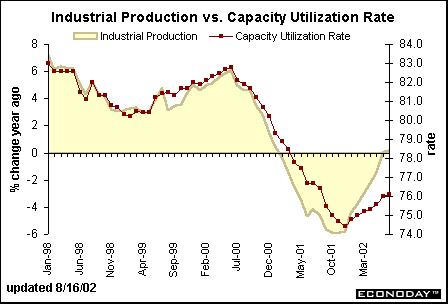
The index of industrial production inched up 0.2 percent in July, significantly less than the gains of the two previous months. Nevertheless, the year-over-year change in production managed to surpass the zero line (+0.2 percent from last July). The capacity utilization rate edged up to 76.1 percent. Yet, the nation's factories are operating well below normal capacity. The low capacity utilization rate bodes well for inflation, but also suggests that capital spending on plant and equipment is not likely to increase in the near term. That will keep production in a slow growth mode for a while.
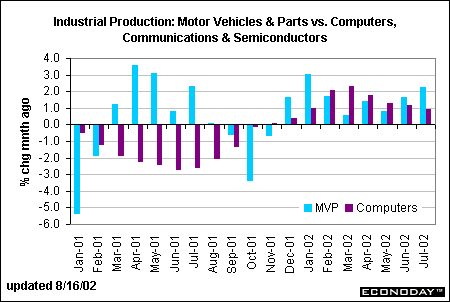
Production is not uniformly weak. A few sectors are showing signs of life. For instance, consumer products jumped 1.8 percent in July and commercial products gained 2.2 percent. In contrast, communications equipment plunged 2.8 percent during the month. In order to smooth out typical monthly fluctuations, the chart below shows a three-month average of the monthly growth rates in motor vehicles and high-tech products. Notice that production of motor vehicles is accelerating while high-tech is moderating. Some chipmakers fear a double-dip recession for their industry. These figures certainly correspond to a slowdown.
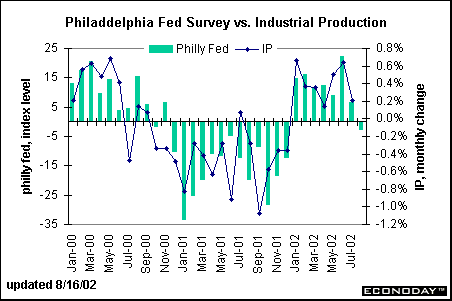
The outlook for industrial production is not promising in the near term. The Philadelphia Fed's business outlook survey took a dive in August, with the general conditions index declining to -3.1 from July's level of 6.6. Any level below zero points to contracting manufacturing activity. This index covers the Philadelphia Federal Reserve district but has always done a good job of predicting industrial production at the national level. The index of industrial production will probably post a decline for August.
CPI remains moderate
The consumer price index increased 0.1 percent for the second straight month in July. Food and energy prices were relatively subdued for the month. Excluding these two volatile components, the core CPI increased 0.2 percent in July after a 0.1 percent gain in the previous month. The total CPI posted a 1.5 percent year-over-year gain in July, a bit higher than last month. In contrast, the core CPI continued to moderate, recording a 2.2 percent rise from last July. The downward trend in the core CPI helps the Fed maintain a more stimulative monetary policy. If inflation were in the pipeline, the question of a rate hike would have to be considered by the Fed, sluggish economic environment or not.
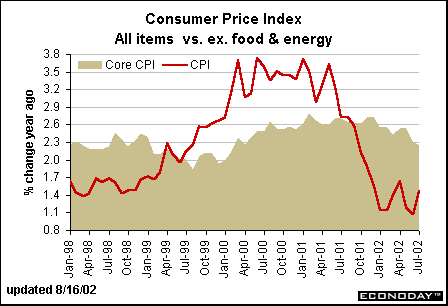
As promised, the Labor Department also unveiled its new chained consumer price index for all urban consumers. The chained CPI index is akin to the deflator for personal consumption expenditures, which allows for changes in its basket of goods to reflect changes in consumer spending patterns. The regular CPI measures a fixed basket of goods. The chained CPI rose 1.1 percent in July compared with a year ago, while the chained core CPI increased 1.6 percent relative to a year ago. In both cases, the chained CPI is showing significantly less inflation than the regular CPI (0.4 percentage points less for the total, and 0.6 percentage points less for the core). The Short Take article published on Aug. 21 will take an in-depth look at the chained CPI.


Markets at a Glance • Recap of US Markets • The Economy • The Bottom Line • Looking Ahead
|