
Nonfarm productivity rises more than expected in Q2
Nonfarm productivity increased at a 1.1 percent rate in the second quarter following a fantastic 8.6 percent growth rate in the first quarter. The second-quarter pace is mild but still twice as fast as predicted by economists. Productivity growth, perhaps over-hyped as a cure-all, is one of the factors that appears to convince Fed Chairman Alan Greenspan that this economic recovery has legs. In the long run, healthy productivity growth helps to expand the wealth of a nation. It allows workers to see fatter paychecks without hurting companies' profit margins.
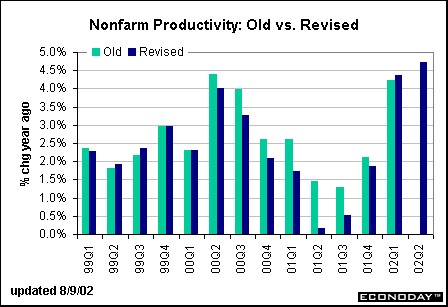
The chart below shows the old and revised growth figures for yearly productivity changes back to 1999. Changes were small for 1999, but for 2000 and 2001 productivity growth was revised lower. Nevertheless, the year-over-year growth path is solid. The yearly growth figures are usually a more reliable guide to productivity growth than oft-quoted quarterly numbers since they allow for cyclical variation and tend to smooth out quarterly changes that may be boosted or dampened by special factors.
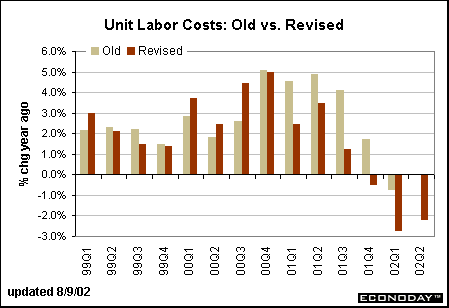
Unit labor costs rose at a 2.4 percent rate in the second quarter after posting declines for the three prior quarters. Unit labor costs tend to rise when productivity moderates or declines. Changes in unit labor costs also tend to move less dramatically on a year-over-year basis. The chart below reveals that unit labor costs were revised downward for most of this three-year period (with the exception of upward revisions in the year 2000). A reduction in unit labor costs mean companies can produce at lower costs and don't necessarily need to raise product prices as demand for their goods increase. On a year-over-year basis, unit labor costs have declined for three quarters now.
On the whole, productivity and unit labor costs data bode well for a quiescent inflation environment. Indeed, July producer prices looked friendly.
PPI falls
The producer price index fell 0.2 percent in July, more than reversing the previous month's 0.1 percent gain. Food (-0.1 percent) and energy prices (+0.1 percent) were quiet in July. Excluding these two typically volatile components, the PPI decreased 0.3 percent with declines in motor vehicle and computer prices leading the way. Lower apparel prices as well as a drop in sporting goods prices helped push down the consumer goods component. This put the core PPI 0.2 percent below year-ago prices. The total PPI is down 1.1 percent from a year ago, not quite as good as earlier this year but still well below the zero line. These figures suggest inflation is not an issue these days.
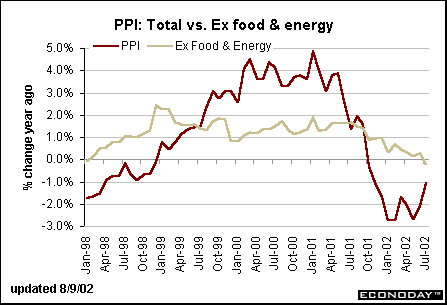
Economists and market players also like to monitor producer prices at earlier stages of processing. The intermediate goods index rose 0.2 percent in July (with and without the volatile components). The total index is down 1.5 percent from July 2001, while the core index is 0.3 percent below year ago levels. These figures don't point to any pressures in the pipeline.
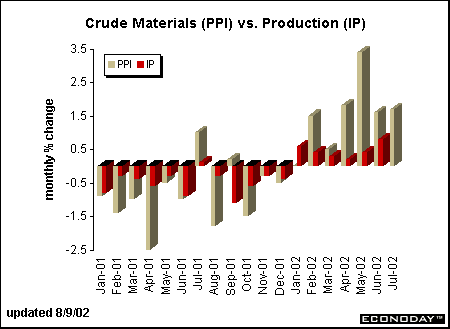
The story is a bit different for the crude materials index. Total crude prices rose 0.6 percent while the core crude materials index jumped 1.7 percent in July. Monthly gains in this index have been robust these past six months. Total crude materials prices are 6.2 percent below year ago levels, but the core (excluding food and energy) crude price index is up 6.9 percent compared to last July. Crude materials prices tend to percolate when demand for manufacturing activity is brewing. This increase in crude materials prices has corresponded with the increases in industrial production over the past several months. Sometimes producers can increase product prices, but in this environment it is unlikely. It will probably hurt profit margins to some degree.
Consumer credit expansion on growth path
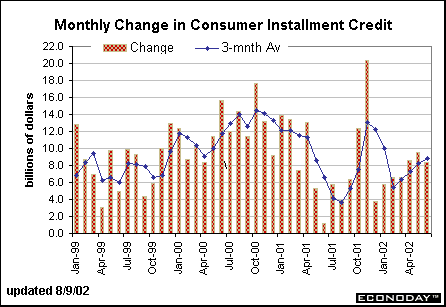
Consumer installment credit expanded $8.4 billion in June, a bit less than the $9.5 billion pace recorded in May. Nevertheless, consumer installment credit continues to trend higher. To some extent, these figures reflect increased borrowing on motor vehicles where interest rates are extremely low. Consumers may also be taking advantage of credit card offers to transfer funds at either zero interest or a low interest rate for six to twelve months. Given the robust housing market, it is likely that some of the credit expansion is going to purchases on large ticket items such as furniture, other home furnishings, and garden appliances. There is no question, though, that consumer credit growth is more moderate these days than it was in 2000 and early 2001. Consumers may still have some room left on their credit cards for the upcoming fall and holiday seasons.


Markets at a Glance • Recap of US Markets • The Economy • The Bottom Line • Looking Ahead
|