 |

Trade deficit narrows
The international trade deficit on goods and services narrowed to $28.3 billion in May from a level of $32 billion in April. Thus far, the
deficit for the two months of the second quarter is lower than the average deficit in the first quarter. As long as the net export balance is
negative, it acts as a drag on GDP. However, when the deficit narrows, as it did in the first quarter and is likely to do again in the second
quarter, it adds to GDP growth.
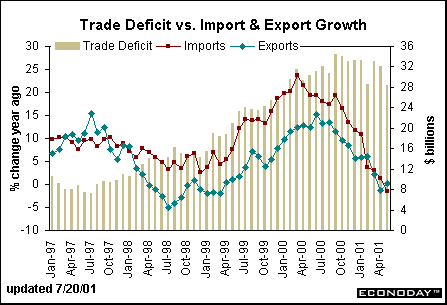
Imports fell 2.4 percent in May for the second straight month and are now down 1.5
percent from year ago levels. The value of total imports is down 7.6 percent from their peak in September 2000. The drop in imports
reflects the moderation in domestic activity. As the economy boomed, consumer and business demand for imports skyrocketed as
foreign goods helped satisfy U.S. demand. Now, foreign producers are hurting too as U.S. demand for consumer and capital goods
declines.
Exports rose 0.9 percent in May, reversing nearly half of the previous
month's drop. Exports are up 0.2 percent from year ago levels but down 4.5 percent from their August peak. A reduction in export demand
comes from weakness abroad. It has played a role in the nine-month decline in industrial production.
Production slump deepens
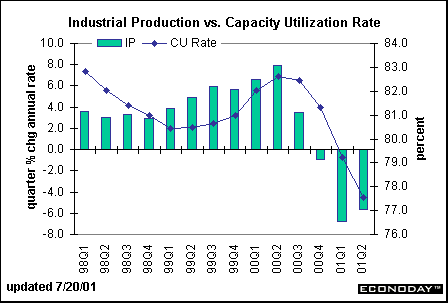
The index of
industrial production declined 0.7 percent in June, its ninth drop in as many months. The chart below depicts the path of industrial
production on a quarterly basis. In the second quarter, production fell at a 5.6 percent rate, just a bit less than the 6.8 percent rate of
decline in the first quarter. The industrial sector has not been in such an extended slump since the recession of 1981-82. Production didn't
decrease for as many months during the 1990-91 recession.
In June, declines were registered across major product groups. Production of consumer goods fell 0.2 percent, construction supplies
declined 0.7 percent, and business equipment dropped a whopping 1.4 percent. Relative to a year ago, business equipment is only down
2 percent, not very different from the 2.2 percent shortfall seen in consumer goods. For a long time, high tech industries continued to grow
even as other sectors declined. That is no longer the case - high tech industries have posted average declines of 1.8 percent since March.
The Fed's interest rate cuts since January were aimed at spurring economic activity - and they will eventually. But in the meantime, the
outlook for production is not very rosy. The Philadelphia Fed's business outlook survey, a leading indicator of industrial production,
showed another deterioration in its index. It remained below the zero line (reflecting a declining manufacturing sector), dropping to a level
of negative 12.2 in July from its level of negative 3.7 in June.
Signs of life in housing
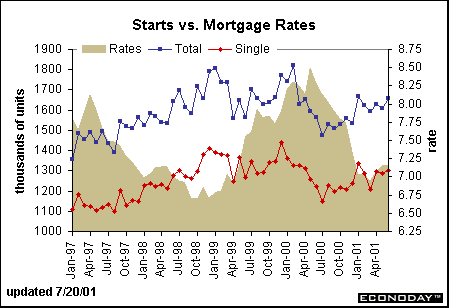
Housing starts rose 3 percent in June to a 1.658 million-unit rate bringing it back to its highest level since January. But if you look closely at
the chart below, you'll see that starts have remained in a narrow range these past six months and haven't really benefited from the Fed's
cumulative drop of 275 basis points in the federal funds rate target. Mortgage rates are actually higher now than they were before the first
rate cut. Since mortgage rates are tied to yields on the 10-year Treasury note, they move in tandem with market rates not administered
Fed rates. Yields on Treasury securities have come down in the past week or so, but were generally increasing during much of the second
quarter. This is a dilemma over which the Fed has no control: they can only control the fed funds target, not yields on market rates. If bond
investors believe that inflationary pressures will result from aggressive Fed easing, they will bid up market yields independent of Fed
action.
CPI creep
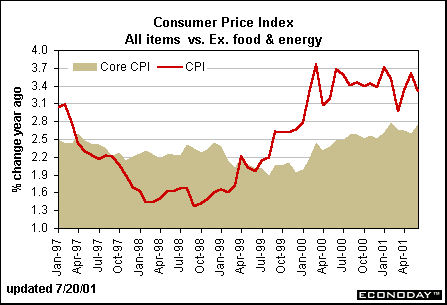
The consumer price index rose 0.2 percent in June, less than the 0.3 and 0.4 percent gains in April and May. Consequently, the yearly rise
in the CPI moderated in June to 3.2 percent. A 0.9 percent drop in energy prices helped to hold down the CPI in June. Excluding the
volatile food and energy components, the CPI rose 0.3 percent during the month, faster than the three previous months. This boosted the
year-over-year rise to 2.7 percent. Notice the upward creep in the core CPI over the past few months. This may be one reason that bond
investors have not taken kindly to the Fed's rate cuts of the past six months.
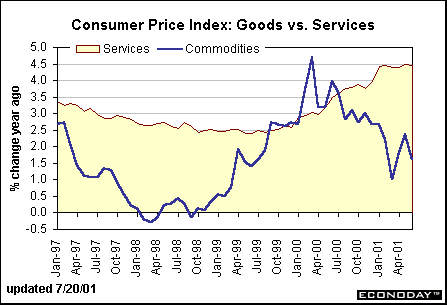
It is useful to look at the breakdown between inflation in services and commodities. Prices for goods have moderated significantly in the
past 18 months, but that's mainly due to the slowdown in energy prices that had surged over the prior two years. In the second quarter,
though, price breaks in nonfood, nonenergy goods have helped hold down the price index. In contrast, prices of services are creeping
ever higher. Prices of services bottomed about two year ago and accelerated during much of 2000. It does appear that these prices have
reached a plateau again in the first half of 2001, albeit a rather high one at 4.5 percent. No doubt, Fed officials are watching this closely.


Markets at a Glance • Recap of US Markets • The Economy • The Bottom Line • Looking Ahead
|
 |