The EconomyEmployment situation shows stagnant labor marketNonfarm payrolls rose a meager 36,000 in June after a downwardly revised gain of 24,000 in May. April’s rise of 6,000 was revised away and replaced with a 21,000 decline. There is no question that the second-quarter employment picture was pretty dismal for a recovery. This brings to mind the painfully slow employment recovery following the 1990-91 recession. Just as every recession is different, so is every recovery. The second quarter saw a miserable labor market, but it doesn’t mean that employment won’t start improving in coming months. For instance, the average workweek picked up to 34.3 hours – the best showing since January 2001. At the same time the factory workweek also edged up to 41.1 from a level of 40.9 in May; it was also the best showing since January 2001. The workweek is considered a leading indicator since employers are likely to increase the number of hours worked rather than hire new staff, that is until employers feel comfortable that increased demand is sustainable. 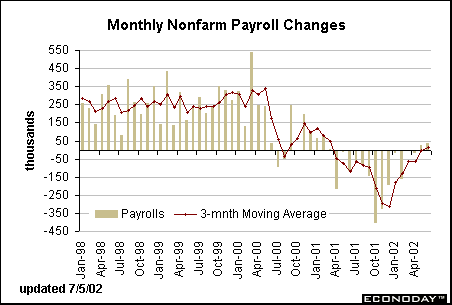
The civilian unemployment rate ticked up 0.1-percentage point to 5.9 percent in June, but essentially remains in the same range as the past several months. A lagging indicator, the unemployment rate typically rises in the early stages of recovery as more people start looking for work on hopes that jobs will be easier to get than during the recession. Growth in the labor force or employment in the household survey are never smooth from one month to the next. In June, both the labor force and employment declined, but employment fell more sharply than the labor force, consequently lifting the jobless rate. 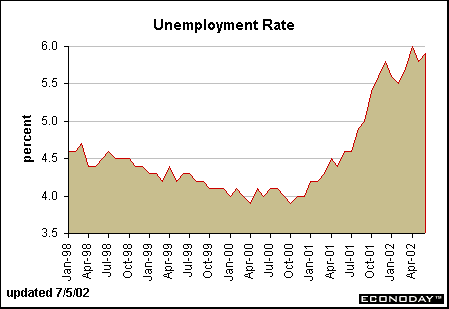
Motor vehicle sales rise, but not enough to satisfyDomestic cars were sold at a 5.8 million-unit rate while light trucks were sold at a 7.4 million-unit rate in June. Auto sales were only marginally better than May, but light truck sales posted a 7.2 percent gain from the previous month. On the whole, the chart below doesn’t suggest that auto sales are particularly sluggish relative to the past couple of years (aside from the October 2001 boost when 0-percent financing was first introduced). Not surprisingly, market players didn’t get overly excited about the news. In any case, most positive economic reports have been virtually ignored in light of the scandal-orama these past few months. General Motors, which actually posted better sales than most other automakers in June, was also dissatisfied with the results. Consequently, they re-introduced 0-percent financing to rev up auto and truck sales this summer. 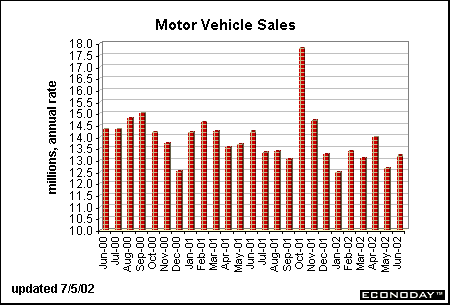
Automakers seem to have gotten greedy with the 14.5 million-unit rate of auto sales that came in tandem with the peak of the stock market in early 2000. It is not fair to look at the current level of auto sales without taking into account the burst from last October. The nine-month average selling pace is 13.8 million units, the same as the average for the nine months from January to September 2001. Certainly auto sales would have weakened during a recession. The chart below compares the 12-month moving average for motor vehicle sales relative to the stock market, measured by the Wilshire 5000. Clearly, sales surged with equity prices beginning in 1998 – and then fell back with the stock market since 2000. But if you look closely, you’ll see that the selling pace lately is not all that different from the selling pace in 1999. Automakers want to re-visit those levels at all costs. They might be better off trying to recapture profit margins rather than sheer volumes. 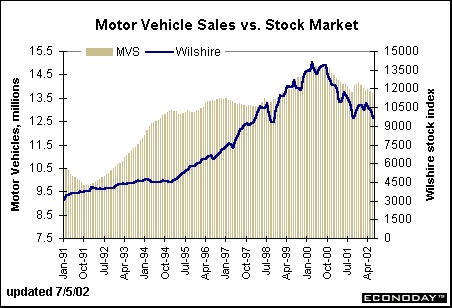
Upward trend in manufacturingFactory orders rose 0.7 percent for the second straight month as both durables and nondurables good posted gains. Nondefense capital goods, a favorite leading indicator of capital spending for most economists including Fed Chairman Alan Greenspan, jumped 4.3 percent in May after a 1.1 percent gain in April. Aircraft orders helped spur the activity in May but not in April. Even after accounting for this volatile sector, nondefense capital goods orders have posted a good two-month run. Nondefense orders are up only marginally in the first five months of this year from the second half of 2001. Orders for high tech are performing better and are nearly level with a year ago. The recovery here is slow, but Fed officials expected that an improvement in capital spending wouldn’t be meaningful until late 2002. 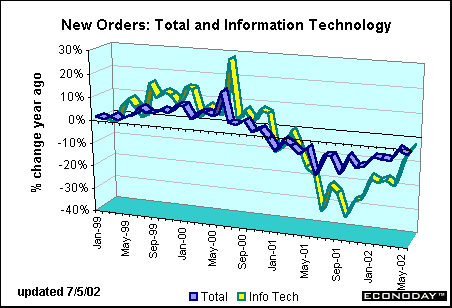
The ISM manufacturing index edged up to 56.2 in June from a level of 55.7 in May. The index isn’t gaining by leaps and bounds, but there is no question that the manufacturing sector continues to improve. Components of the survey posted modest declines in June but still remained above the 50 percent mark that points to expansion. The outlook for orders and production remains positive based on the roughly 60 percent levels posted in June. 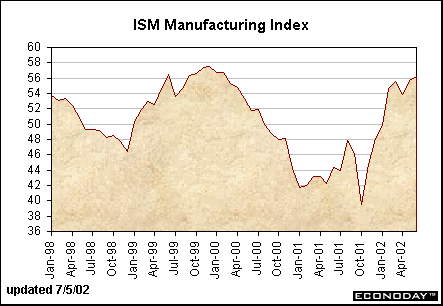
Construction moves in different directionsConstruction expenditures fell 0.7 percent in May, more than offsetting April’s 0.4 percent rise. Over the past year, increases in residential construction have offset declines in nonresidential construction expenditures. Both decreased in May but residential construction spending is still 7.4 percent above year-ago levels. Nonresidential construction expenditures, on the other hand, are 14.4 percent below last year. Vacancy rates for commercial buildings have climbed sharply in the past year. It is too soon to call a peak in commercial vacancy rates, thus it could take several more months before nonresidential construction starts to improve for real. 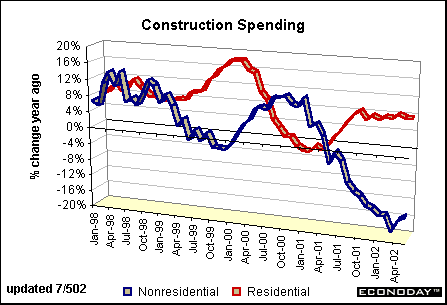
|


