The EconomyHousing: the economy’s soaring starHousing starts jumped 11.6 percent in May to a 1.733 million-unit rate, more than reversing April’s 7.3 percent decline. Starts were only slightly below the recent high level posted in February when unseasonably warm weather boosted starts. Multi-family housing starts surged 20.3 percent and nearly reversed the April drop. Single-family housing starts gained 9.6 percent for the month. This is more important than the rebound in the multi-family sector because single-family construction constitutes the lion’s share of the total and is more sensitive to interest rate changes. The 30-year mortgage rate averaged 6.81 percent in May, the lowest since November when the rate averaged 6.66 percent. Mortgage rates fell to 6.63 percent in the third week of June. 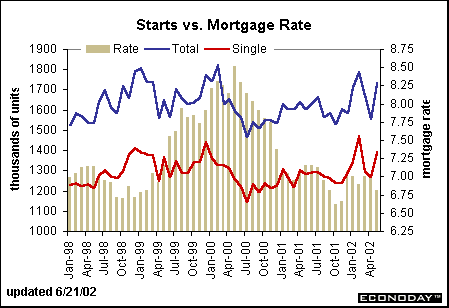
One can never be sure when the last hurrah will come for the housing market. Nevertheless, it is not likely to be soon. The chart below shows weekly purchase applications from the Mortgage Bankers Association along with weekly mortgage rates from Freddie Mac. It appears that mortgage rates in the range from 6.7 to 7.2 didn’t have too much impact on housing, as housing activity moved in a narrow range during this time frame. But when mortgage rates hit 6.5 percent there was a definite increase in the pace of housing demand. We may see some additional forward momentum in housing starts if mortgage rates get that low again this summer. Most analysts aren’t predicting such low rates but given the activity in the Treasury market lately, one can never be sure. 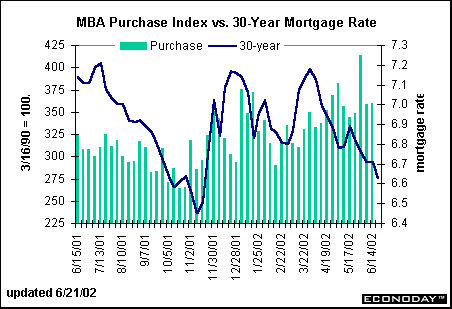
Mortgage rates don’t just affect new homebuyers. For a variety of reasons, homeowners decide to refinance the mortgage loan on their existing home. For instance, some homeowners simply want to benefit from lower mortgage rates and lower mortgage payments. It does give them additional discretionary income for retail sales. Other homeowners refinance in order to cash out some of the increased equity in their home to either make other investments (a second home?) or to pay off high-rate credit card debt. Cash-out refinancings are a mixed blessing. They can help consumers get rid of high-interest debt, but they also reduce a homeowner’s equity. Sometimes homeowners end up building credit card debt all over again and the bottom line turns out negative. 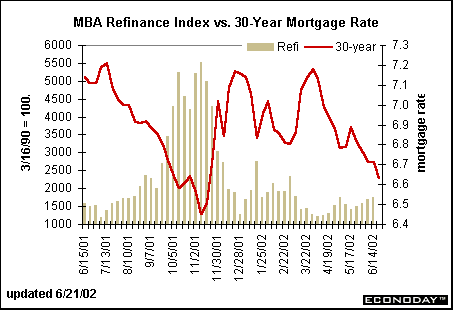
Given the refinancing boom of late 2001, it is hard to believe that current refinancing levels are high. But the current refinancing index at 1500 compares with the 1990 level of 100, against which refinancing activity is tied. That’s a heavy load of refinancing! It only looks paltry in comparison to the 5500 index level of late last year. Given that so many homeowners refinanced only a short time ago, rates would have to be in the 6 to 6.5 percent range, somewhat lower than today, in order to trigger a new round of refinancing. There are at least a couple of reasons why refinancing activity is much more robust than it used to be even 10 years ago. Homeowners have become accustomed to refinancing their mortgage loans. Some may have refinanced their loans two or three times already. The mystery and fear associated with these loans have disappeared. In addition, the old rule of thumb that mortgage rates need to be two percentage points less than your current mortgage rate no longer applies. Sometimes, it may be worth refinancing a home if the mortgage rate is only 50 basis points less. Whether the transaction is profitable at 50, 100 or 150 basis points often depends on the reason for refinancing. Don’t forget, though, that there are costs associated with refinancing (and these are often not recuperated for at least several months if not longer). Trade deficit widens but implies demand pick upThe international trade deficit on goods and services widened to $35.9 billion in April from a $32.5 billion shortfall in March. Imports and exports both rose, but imports increased twice as fast and boosted the deficit. Though imports and exports are still down on a year-over-year basis, they have improved dramatically over the past six months. A good chunk of the import rise was due to larger oil volume and prices. Nevertheless, import demand picked up steam across the board, including for capital and consumer goods. 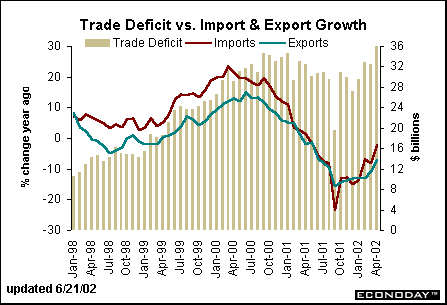
Higher imports mean that the economic recovery is well in place. Demand would not be rising in a downturn. At the same time, our major trading partners are not benefiting from the same growth. Consequently, U.S. exports are rising much more slowly. Thus, the trade deficit is a mixed blessing. On the one hand it signals strong U.S. demand for goods and services, but it also means that these items are produced overseas. Production on the mendThe outlook for industrial production is improving. The Philadelphia Federal Reserve's business outlook survey surged in June to 22.2 from May’s level of 9.1. This index reflects manufacturing activity in the Philadelphia Fed's district, but it serves as a good leading indicator of industrial production. Notice that over the last couple of months the pace of industrial production has moderated in line with a moderation in the survey. The June boost could suggest that manufacturing activity accelerated across the nation during the month. 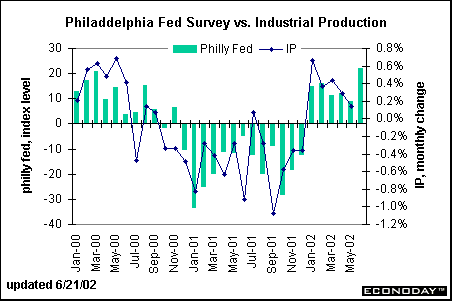
Semiconductor Equipment and Materials International (SEMI) posted its latest figures on bookings and billings in the industry. The book-to-bill ratio increased to 1.26 in May from 1.22 in April. Books and shipments (billings) have both recorded healthy gains in the past couple of months. The chart above compares the book-to-bill ratio with the Philadelphia Semiconductor (stock) Index. The two tend to move in the same direction over time. In April and May, the Semiconductor index declined even as the book-to-bill ratio increased. This suggests that semiconductor stocks certainly have room to increase given the rising trend in business activity in the industry. 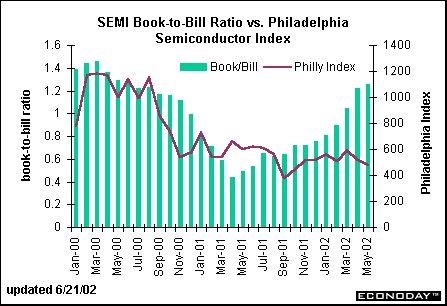
What inflation?The consumer price index was unchanged in May after posting a 0.5 percent spurt in April. Both food and energy prices fell during the month. Excluding these two volatile components, the CPI rose 0.2 percent, less than April’s 0.3 percent gain but in line with the average of the past several months. This puts the total CPI 1.2 percent above last May and the core CPI 2.5 percent above year ago levels. The bulk of the CPI's movements over the past few years can be attributed to energy prices; food prices have been mostly stable except for the past few months when activity has been a bit more dramatic than usual. Notice that the core CPI has not varied much since about July 2000. 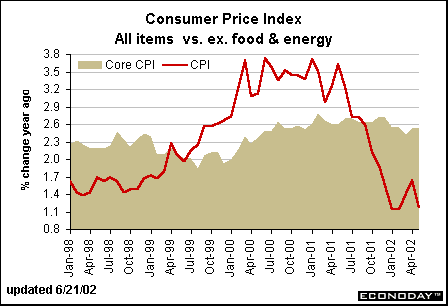
While it is conventional to look at the core CPI to get a sense of underlying price changes, we like to break down the CPI into its two main components: services and goods. Prices of goods – which include food and energy – are quite volatile. Some of the volatility is associated with tobacco prices, which can fluctuate sharply from one month to the next. The downward trend can be partly attributed to high tech goods where prices fall more than rise. But goods only account for 41 percent of the CPI. Services make up the bulk of the CPI, and prices of services are much more glacial in their movements. Notice that prices of services didn’t begin to rise until the middle of 2000 and into 2001 – in the late stage of the expansion. Prices of services have started coming down, or rather, the rate of increase has moderated significantly in the past year. It is unlikely that these will begin to rise in the early stages of a recovery. This gives the Fed room to maneuver during the recovery without having to worry about an imminent onset of inflationary pressures. 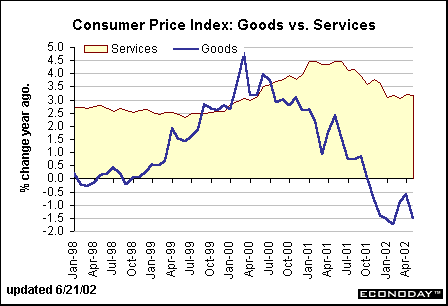
|