The EconomyProduction inches forwardThe index of industrial production edged up 0.2 percent in May after a downward revised gain of 0.3 percent in April. On a year-over-year basis, production was still down 1.6 percent, but there is no question that the quarterly path shows improvement. Production increased at a 2.7 percent rate in the first quarter and grew at a 3.1 percent rate in the first two months of this quarter. Granted, production has a long way to go to recuperate the sharp declines of the previous five quarters (from the end of 2000 through the end of 2001). Nevertheless, there is room for growth based on the moderate gains we have already seen in factory orders and the fact that inventories are currently so lean. 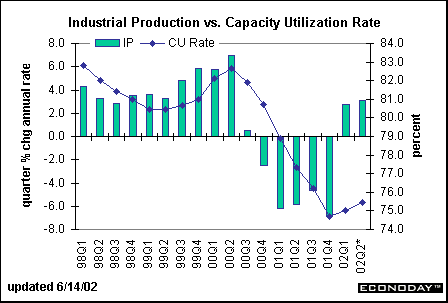
It is not surprising to see weakness in the production report. For instance, consumer products fell 0.4 percent in May, reversing more than half of April’s rise. Commercial products also dropped sharply during the month. But selected high tech industries continued their healthy run, rising 1.2 percent in May, the seventh gain of the past eight months. Notice that high tech production is now 3.7 percent above year ago levels, the second month in which yearly gains are above the zero line! The rest of manufacturing isn’t doing quite as well, down 1.6 percent versus a year ago. Nevertheless, it is trending up as well. 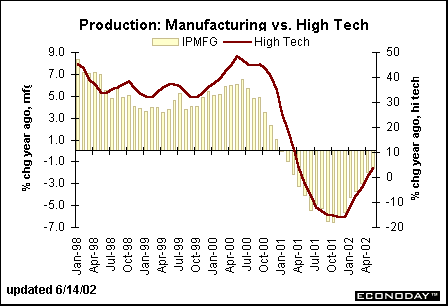
All in all, it appears that production growth is moving at a snail’s pace, but the composition of growth isn’t all that bad. Over the past few months, each of the industries and sectors has picked up, in fits and spurts but a trend that looks like it will continue. Retail sales slideTotal retail sales fell 0.9 percent in May, nearly reversing April’s 1.2 percent rise. A 2.5 percent drop in sales at auto dealers was the primary cause for the weakness, but non-auto sales were also weak, inching 0.4 percent lower during the month. Sales were weakest at general merchandise stores and at clothing and accessory stores. Yet, furniture and electronic/appliance stores performed fairly well. This isn’t surprising given that the housing market is enjoying such extraordinary activity. New homeowners are celebrating by getting new furniture and appliances. The monthly retail sales figures are somewhat misleading because so much of the movement in the past several months has been due to gasoline service stations. Moreover, it isn’t the volume as much as the price action in gasoline that is skewing the data lately. In the beginning of the year gas prices were rising sharply and this boosted gas station sales. But in May gas prices fell and so did gas station sales, dampening total retail sales figures for the month. The chart below shows the quarterly pattern of retail sales, excluding autos and also excluding autos and gas station sales. Notice that nonauto, nongas retail sales were fairly healthy in the first two months of the second quarter relative to the first quarter. 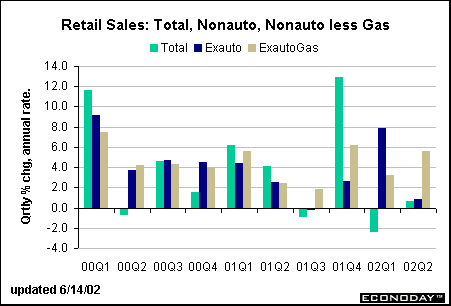
Granted, the monthly pattern of retail is pretty anemic suggesting that consumers have not come back to the mall in full force. The mid-month reading on consumer sentiment dropped to 90.8 from a level of 96.9 in May. When the sentiment index shifts by one or two percentage points, it is usually not very meaningful, but the six point drop is somewhat disconcerting. But consider that the stock market has been declining rapidly over the past month and consumers are bombarded with warnings that terrorist attacks on U.S. soil are a certainty (at some point). Who wouldn’t begin to get more pessimistic? In any case, consumer sentiment can shift rapidly. Thus, if labor market conditions improve and the market would improve, no doubt confidence would pick up as well. 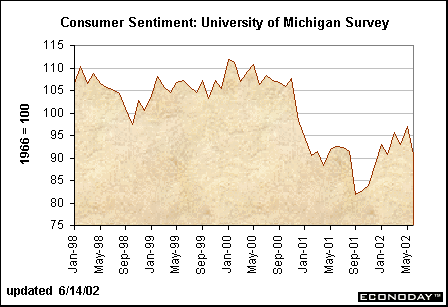
What inflation?The producer price index fell 0.4 percent in May following a 0.2 percent drop in April. Food prices fell 0.2 percent and energy prices declined 2.3 percent. Excluding these two volatile components, the core PPI was unchanged in May and was up 0.1 percent in the two previous months. Consequently, the PPI was 2.7 percent below year ago levels while the core PPI (excluding food and energy prices) was only 0.1 percent above last May. 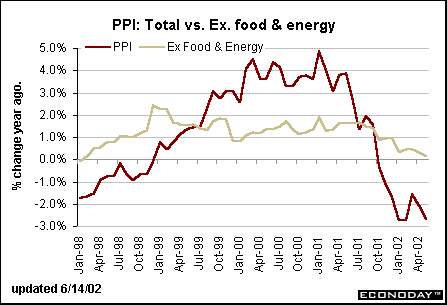
It doesn’t appear that there are inflationary pressures in the pipeline. The intermediate price index fell 0.5 percent in May and the core components were flat for the month. The crude goods index did jump 1.7 percent with its core components spurting 3.4 percent, but the gains are from very low levels. Total crude goods prices are still 15.8 percent below a year ago. Keep in mind that the crude goods index incorporates the kind of goods that are very sensitive to price changes and are in tune with manufacturing activity. Thus, the gains in crude materials prices (often called sensitive prices) correspond to the improvement we have seen in industrial production since the beginning of the year. When economic recovery is soft, price pressures don't develop rapidly and aren’t passed along the pipeline. It could hurt profitability unless manufacturers work on enhancing productivity. |