The EconomyMeager improvementsThe civilian unemployment rate edged down to 5.8 percent in May from a level of 6 percent in June. This was better than economists’ consensus forecast and a 0.2 percentage point change is considered statistically significant. Yet, market players were not impressed when they learned that the number of unemployed persons was not all that different from the level recorded last December. The disappointment with this portion of the report is unfairly severe. The jobless rate is a lagging indicator of activity after all. Moreover, the household survey reveals that employment jumped by 441,000 in May after a more modest 82,000 gain in April. 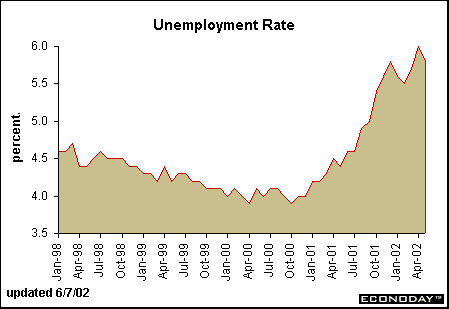
Never mind about household survey employment, market players tend to focus on nonfarm payroll employment. Payrolls edged up 41,000 in May, not far off from expectations. However, the previous months’ figures were revised down again. In fact, the benchmark revisions revealed that the entire twelve months prior were lower than initially estimated. (Unless GDP growth is revised down with the July revision, the lower levels of employment imply stronger productivity gains for the past year.) More relevant for the current quarter, flat employment growth (coupled with no change in hours worked) implies that growth stalled in the second quarter after spurting in the first. No wonder equity investors have become disillusioned lately. 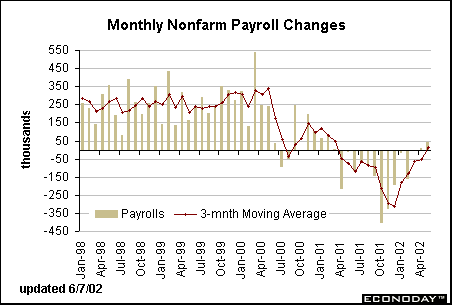
Since the employment report usually sets the tone for the month, it is likely that the negative sentiment we have seen in the past month will persist. It would take very friendly retail sales and industrial production figures to change it. However, chain-store sales reported this week and Friday’s employment report indicate that these mid-month indicators will very likely be soggy. Motor vehicle sales plungeDomestic cars were sold at a 5.7 million-unit rate in May while light trucks were sold at a 6.9 million-unit rate. In both cases, sales were lower than predicted by economists but investors shouldn’t have been surprised. Remember that motor vehicle sales zoomed to unprecedented heights in October when automakers offered various incentives including zero percent financing on cars and trucks. At the time, many economists suggested that this would borrow from future sales. When motor vehicle sales held on at a pretty decent rate, analysts started believing that a new market had been tapped. In fact, an end of the incentives brought sales down to more earthly levels. The May selling pace of 12.7 million units (at a seasonally adjusted annual rate) appears weak by comparison of the past few months, but put in the context of historical selling seasons, it isn’t all that bad. But automakers were nevertheless disheartened with the sales pace and ended up putting new incentives in place early this month. 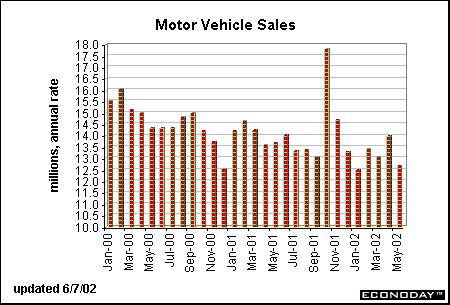
When gasoline prices started to rise rapidly from 1999 to 2001, many analysts became concerned that it would hurt light truck sales. The chart below reveals that truck sales, as a percent of total motor vehicle sales, have climbed right through periods of high gas prices. Yet truck sales are now feeling the pinch, declining as gasoline prices have started to rise. 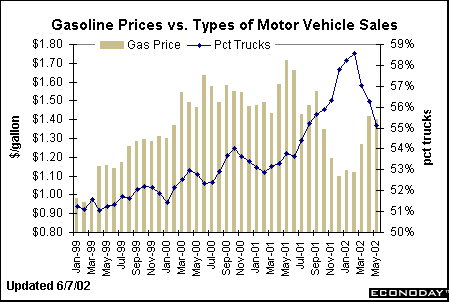
It is unlikely that the recent moderation in light truck sales (SUVs and minivans) is suddenly due to rising gas prices. The drop in truck sales also corresponds to a drop in total motor vehicle sales. That is, because of the prior boom, light truck sales now have more room to decline as consumers scale back. Auto sales have also been on the decline, but a much smaller one. Unlike truck sales, auto sales have failed to respond to friendly incentives over the past few months. It would make sense, then, that sales of SUVs and mini-vans would be reduced more when incentives were off. ISM series bring good newsMay was a good month for the ISM indicators. The May ISM manufacturing index rose to 55.7 from a level of 53.9 in April. This was a modest gain, but the manufacturing index has remained well above 50 percent since February. Among the five key components, only employment is below 50; new orders are running well over 60 percent and production is approaching 60 percent. This bodes well for upcoming months. 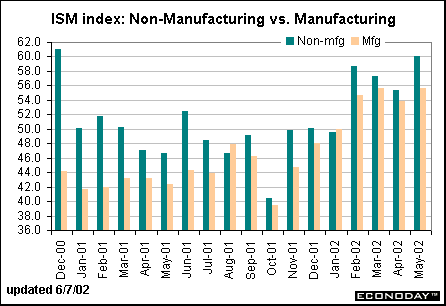
The ISM non-manufacturing index is not a composite index like its manufacturing cousin. Rather the index that garners all the attention here is the production component. Notice that production in the service sector reached 60.1 in May, its highest level since December 2000. This confirms that the economic recovery has been in place since February, which bodes well for coming months. Construction spending on the mend?Residential construction rose 0.7 percent while nonresidential construction spending increased 1.5 percent in April. Residential construction spending stood 8.5 percent above year ago levels in April, an improvement over the previous few months. It also appears that nonresidential construction spending may have hit bottom in March as the year-over-year decline was smaller than in April. As one can see from the chart below, it isn’t unusual for residential and nonresidential construction spending to move in opposite directions over the business cycle. In fact, the period when they both moved in tandem in 1998 is more atypical. Thus, if nonresidential construction spending starts heating up, don’t be surprised if residential spending slows. Indeed, even though most economists have given up on their forecasts that housing starts would decline in 2002, most are still looking for housing construction to remain stable with a year-over-year change close to zero. 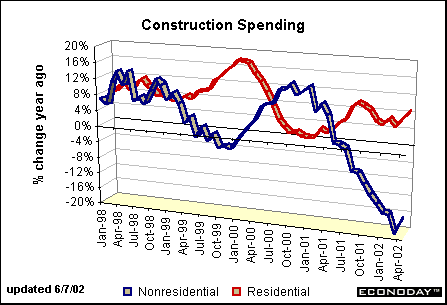
|