The EconomyProductivity spurt typical for recoveryThe Labor Department’s revised estimate showed that nonfarm business productivity surged at a whopping 8.4 percent rate in the first quarter after rising at a 5.5 percent pace in the fourth quarter. Productivity often accelerates sharply in the early stages of recovery because employers are slow to hire when demand initially picks up steam. Once the demand for goods and services is deemed sustainable, then employment rises more steadily and the productivity gains become more subdued. 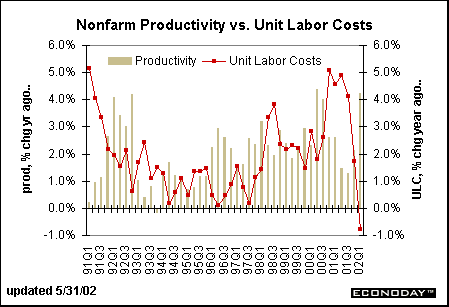
The spurt in productivity shouldn’t be all that surprising considering that industrial production is turning around at the same time that factory payrolls are still in decline. While total manufacturing productivity surged at a 9.4 percent rate in the first quarter, the increase among durable good producers was even more astounding at a 13.3 percent rate! Quarterly productivity increases can be a bit misleading, thus we look at year-over-year changes in productivity – and unit labor costs – to give us a smoother picture. The chart above shows that productivity peaked in early 2000 and then slowed quarter after quarter until it hit its low in the third quarter of 2001. First quarter productivity is likely to be a new peak for a while; count on a more moderate growth pace in coming quarters. (Note that the chart shows year-over-year trends where growth has not approached a pace as high as 8.4 percent. The yearly pace was 4.2 percent in the first quarter.) Nevertheless, productivity gains will help to promote wage gains without adding inflation. At the same time, low unit labor costs, albeit not likely to remain negative in the future, will help keep down business costs and could spur profit margins. Home sales inch higherExisting single-family home sales jumped 7 percent in April to a 5.79 million-unit rate, reversing most of the March decline. Sales are 9.5 percent higher than year ago levels. The chart below shows that existing home sales are reaching new highs in 2002. Even though mortgage rates increased in 1999 and 2000, sales of existing single-family homes ran at about the same pace both before and after the rate hike. While the gains in the first two months of the year could easily be attributed to unseasonable weather, there is no question that the pace of sales for the first four months of the year (which includes a normal Spring selling season) was above average. Economists had expected to see some moderation in the housing market – particularly since activity was so healthy during the recession. Now, conventional wisdom says that consumers are buying homes because the housing market is appreciating while the equity market is not. If consumers do indeed feel skittish about stocks, then housing activity could continue a decent run. 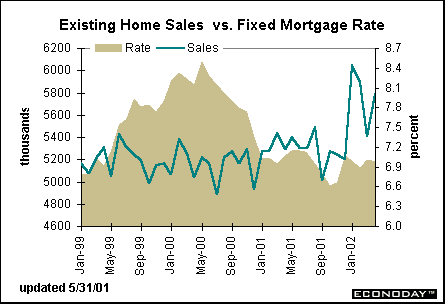
The regional distribution of existing single-family home sales show that the South and West were up significantly relative to their 12-month moving average. Sales in the Northeast and Midwest were running on par with the most recent 12-month period. 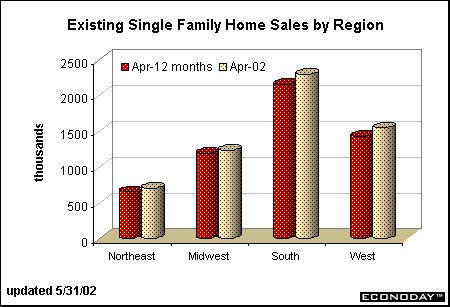
As long as home sales continue to increase, housing-related sectors should perform well. That means that retail spending on furniture and appliances as well as home furnishings should increase in coming months. Consumer moves into new or existing homes also bodes well for building materials since new homeowners often remodel their newly-purchased homes to better accommodate their individual needs. Consumers may not be as exuberant as they were in 1999 and 2000 before the stock market collapsed, but they are becoming more optimistic. Both the Conference Board’s and University of Michigan’s confidence measures increased modestly in May. The series are climbing, albeit slowly. As long as confidence heads higher, the likelihood increases that consumers will invest further in homes and spend money on goods and services in the coming year. 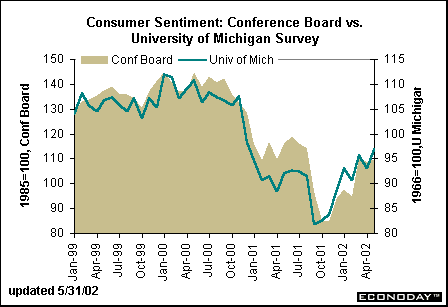
Most recently, consumer spending patterns have come more in line with historical trends. The yearly growth in consumer spending has moderated from the heady pace of 1999 and 2000 and was surpassed briefly by income growth. In April, personal rose 0.3 percent, out done by consumption expenditures which rose 0.5 percent. Since January, it appears that yearly gains in consumption expenditures are starting to climb once more, but are still well below yearly income gains. While the personal saving rate remains below historical norms, the current level is about twice as high as it was two years ago. 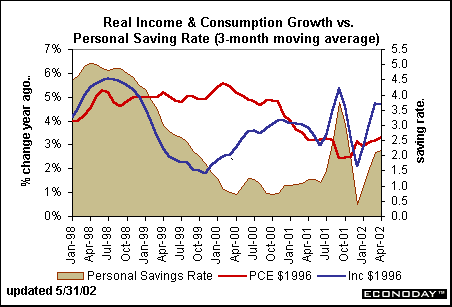
Factory orders riseFactory orders increased 1.2 percent in April after rising 1 percent in March. This allows the year-over-year change in total orders to approach the zero mark, although orders are still down 2 percent. Nevertheless, gains are broad-based across the various industries. The chart below compares yearly growth in total orders versus the information technology sector. While orders for IT are still down roughly 12 percent from a year ago, there is no question that monthly gains are robust. 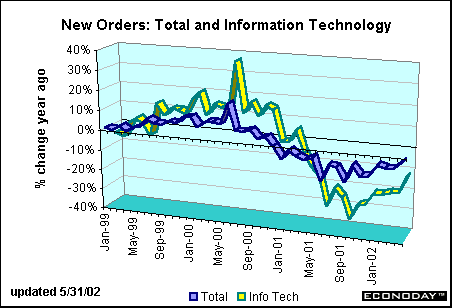
Factory orders were not the only indicator showing improvement in manufacturing. The NAPM-Chicago (alias the PMAC survey) jumped in May to 60.8, a rise of six percentage points. This put the index at its highest level since early 1999. Notice that the NAPM-Chicago moves in tandem with the ISM manufacturing index. The ISM figures will be reported on Monday, but economists have revised up their initial forecasts to show a moderate rise in the national figure as well. On the whole, these figures bode well for industrial production in coming months. 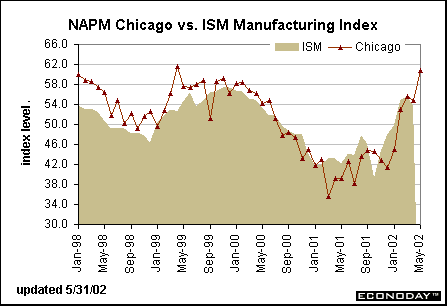
|