The EconomyCommerce revises GDP downwardThe Commerce Department estimated that real GDP expanded at a 5.6 percent rate in the first quarter. This is a slight downward revision from the advance report that showed a 5.8 percent rate. More interesting, though, was the fact that the consensus forecast had been looking for an upward, not downward, revision to the data. Just about every major component was revised lower with the exception of net exports. As it turns out, imports were revised down quite a bit more than exports and thus the net export deficit was smaller than anticipated. While consumer spending as well as capital spending were revised down slightly, the overall picture didn’t change. The consumer sector is leading the economy out of recession with spending on goods such as motor vehicles and on housing. 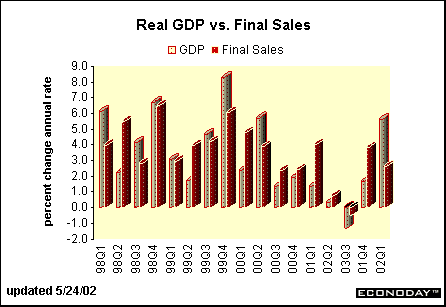
The element in the GDP report that truly impacts upcoming quarters is the change in business inventories. Though inventories were liquidated for five straight quarters, first-quarter 2002 saw the smallest degree of liquidation. It suggests the inventory correction is just about over and inventory building may be on its way in coming months. This bodes well for production, particularly since real final sales have grown at a rapid clip in the past two quarters. 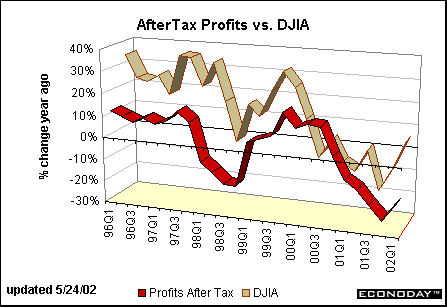
This GDP report also included preliminary figures on corporate profits for the first quarter. After-tax corporate profits rose 0.9 percent in the first quarter from the previous quarter, meager but still the first quarter-to-quarter gain since the third quarter of 2000. Yet market players are accustomed to looking at profits on a year-over-year basis, as are individual companies. The chart above shows that after-tax profits were down 17.3 percent in the first quarter, better than the 24.5 percent drop recorded in the fourth quarter of last year. While profits are not expanding rapidly, they are at least now headed in the right direction. Notice that after-tax profits tend to move in tandem with stock prices (measured by the DJIA). The Dow has moved up slightly more rapidly than profits in the past year, but it does signal that profits should be headed up too. Home sales inch higherNew home sales rose 1 percent in April to a 915,000-unit rate, reversing one-third of the March decline. Sales are 1.6 percent higher than year ago levels. The chart below shows that home sales were at their cyclical low in 2000 when mortgage rates were running at 8 – 8 ½ percent. Since rates have fallen from these highs, new home sales have fluctuated within a narrower range. A quick look at the chart below shows that since 1998 home sales have held in a range of 800,000-to-1 million units, with moderate variations triggered by interest rate changes. 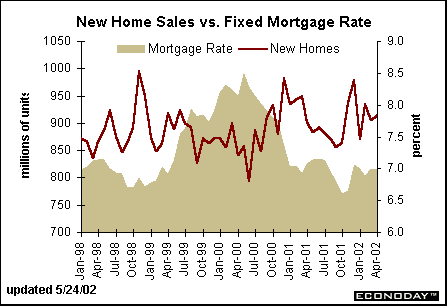
The regional distribution of new home sales appeared somewhat unusual for the month. That is, sales plunged in the Northeast, fell modestly in the South and West, but surged in the Midwest. But one should look at regional data over a longer time frame than just one month. The green bars in the chart below show the 12-month average pace of new home sales among the country's four major regions. The brick bars reflect the level of sales for the month of April. On the whole, there is not much difference in trend.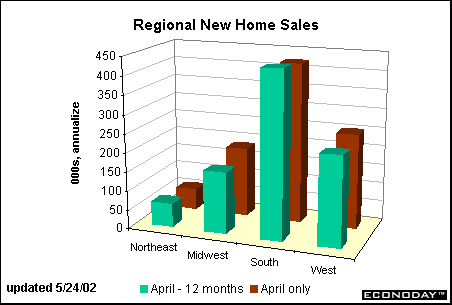
Durable goods orders on the mendNew orders for durable goods rose 1.1 percent in April, the fifth consecutive monthly gain in this volatile series. According to the preliminary figures, aircraft orders plunged 37.1 percent, not meshing with news from Boeing that its April orders rose 33 percent. This could mean that durable goods orders will be revised when more complete data become available. In any case, economists were predicting a moderate rise in April because of aircraft orders, but instead, the gain came in the core components of nondefense capital goods. This suggests some underlying strength in the orders series and bodes well for industrial production. 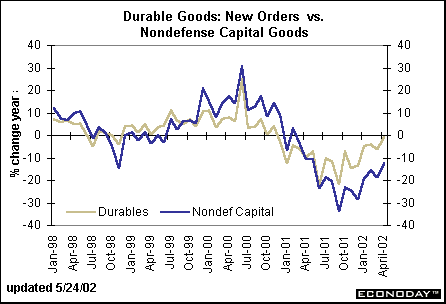
Lead on the labor marketNew jobless claims declined in the week ended May 18, recording the fifth drop in seven weeks. In late March, new jobless claims were skewed by the re-filings of workers whose unemployment benefits had run out and were allowed to apply again under a federal program. These long-term unemployed workers (unemployment benefits last for 13 weeks) were not new claimants, but previously laid-off workers. From an economic standpoint, it is important to distinguish between newly laid-off workers and workers who are re-filing. If employers are still firing workers in droves, it means they believe economic conditions are worsening. But if the pace of new lay-offs moderates, then labor market conditions are stabilizing even without gains in the rate of new hires. 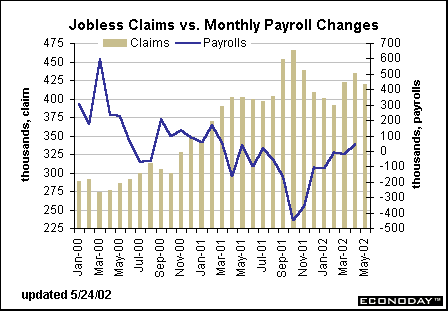
The chart above compares new jobless claims to monthly changes in nonfarm payrolls. Current levels of new claims are associated with little change in payrolls. Currently, economists are predicting that nonfarm payrolls will increase 50,000 in May, consistent with past experience based on the level of claims. |