Soggy retail sales
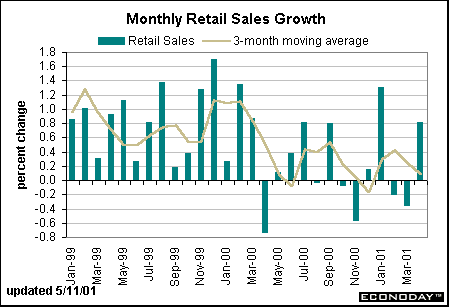
Retail sales jumped 0.8 percent in April after declining in each of the previous two months. Auto dealers posted a 1 percent rise in sales for the month, helping to boost the total. Excluding the volatile auto group, retail sales rose 0.7 percent suggesting that consumers were once again opening their pocketbooks. In reality, the figure is somewhat misleading. The 3-month moving average trend line in the chart below, more indicative of the true path, tells a different story.

First, while the April gain more than offsets the March decline, two-month growth is still anemic. For instance, sales at building materials stores jumped 1.5 percent in April, but this follows a 1 percent drop in March. That leaves little in the way of two-month growth. Moreover, furniture store sales declined in both months, as the path of housing construction heads lower, albeit at a modest pace.
Among nondurable goods, the figures look slightly better. General merchandise store sales jumped 2.1 percent in April, still leaving a good gain even after taking into account the 0.7 percent drop in March. Food store sales inched up in both months, but barely kept up with food price inflation. Sales at gasoline service stations jumped 2.5 percent in April - related to price hikes - but follows a decline of 2.1 percent in March. Apparel store sales gained in April, but in March they declined. Restaurant sales declined in April as well. This latter component is a good indicator of confidence: consumers will eat out more when they fell optimistic about economic conditions. That didn't seem to be the case in April.
Perhaps consumer spending conditions may improve in May. The early reading on the University of Michigan's consumer sentiment index revealed a four-point rise in the index to 92.6 percent. This is the first rise after three straight declines. Consumer sentiment may have improved after the last rate cut by the Fed in mid-April.
PPI on trend
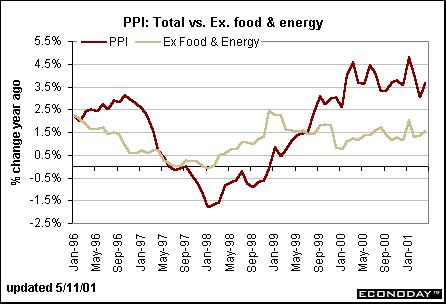
The producer price index rose 0.3 percent in April, just a bit less than the average monthly gain posted in the first quarter. This put the PPI 3.6 percent above year ago levels. Note that the yearly gains in the PPI have fluctuated in a rather wide range over the past twelve months. The April hike was on the lower end of the range.

Excluding the volatile food and energy components, the PPI increased 0.2 percent in April, somewhat faster than the average monthly gain posted in the first quarter. Tobacco and car prices, which have often caused blips in this index, were not factors in the April rise. Indeed, the major drivers behind the gain included computer prices, drug prices, and aircraft prices.
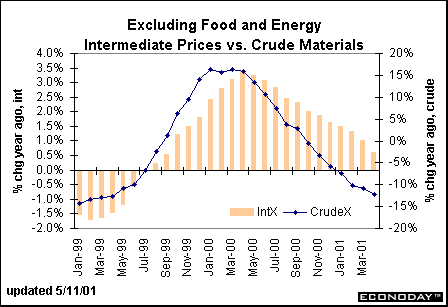
It is useful to look at price changes for earlier stages of processing. The chart below compares the year-over-year change in the intermediate and crude materials indices excluding food and energy. The crude materials index is down about 12 percent from year ago levels, and the intermediate materials index is up less than one percent. Note the persistent downward trend. This should eventually translate into the finished goods index as well.

Productivity machine stalls
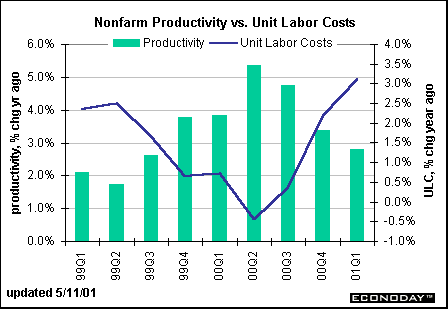
Nonfarm business productivity inched down at a 0.1 percent rate in the first quarter of 2001 after posting average quarterly gains of 3.4 percent in 2000. Productivity gains rose in tandem with the robust pace of GDP growth. As economic activity moderated over the past six months, so has productivity. A slowdown in productivity means that wealth generation will come at a slower pace. Wages can increase at a healthy clip with productivity gains, but without them, wage gains become inflationary.

Since productivity growth can be volatile from one quarter to the next, we compared nonfarm productivity with unit labor costs on a year-over-year basis. It shows that productivity did moderate substantially from the middle of 2000, but is still higher than year ago levels. At the same time, unit labor costs have picked up steam as it becomes more expensive to produce goods and services with less productive workers.


Markets at a Glance • Recap of US Markets • The Economy • The Bottom Line • Looking Ahead
|