Production ending its negative string?
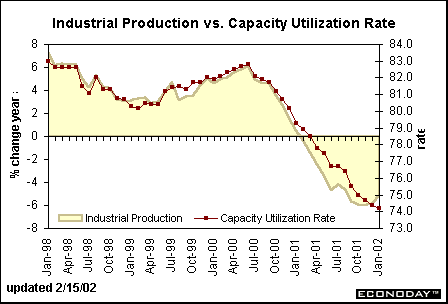
The index of industrial production edged down 0.1 percent in January after a downwardly revised drop of 0.3
percent in December. Production is on a long string of declines going back to the middle of 2000. On a year-
over-year basis, production is down 5.2 percent, somewhat less than the past couple of months. Given
improvements in the ISM manufacturing report, the Philadelphia Fed's business outlook survey and factory
orders for the past few months, it is likely that production may see a turnaround soon. In addition to the pick up
in new orders, the decline in business inventories appears to be coming to an end. Low inventory levels
suggest that only a small rise in demand will be sufficient to get production back in growth stages.

Production by market group shows a mixed bag. For instance automotive products are down, but that's to be
expected after the fourth-quarter surge. Home electronics declined in January but were up sharply in November
and December. Production of appliances, carpet & furniture has increased for three straight months from
November to January, although the gains were limited by flat housing activity. Among nondurable goods,
chemical products is the only industry posting consistent gains the past several months. Business equipment is
still soggy for the most part, but defense and space equipment are posting healthy gains. If these patterns
persist it is possible that we will see a return to growth for industrial production in the next couple of months.
Inflation takes a back seat
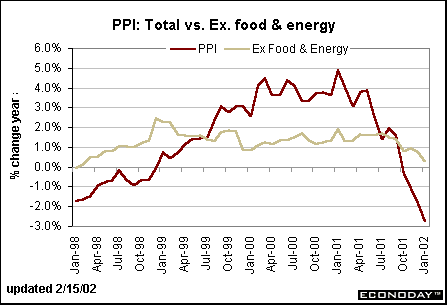
The producer price index edged up 0.2 percent in January after declining 0.5 and 0.6 percent in November and
December, respectively. This put the PPI 2.6 percent below year-earlier levels as the index benefited by a 20.1
percent drop in energy prices over the period. In January, energy prices inched up 0.1 percent. Excluding the
volatile food and energy components, the PPI decreased 0.1 percent in January after remaining unchanged in
the previous month. Declines in tobacco products and light trucks helped to push down the index. In any case,
prices overall remained subdued. The PPI excluding food and energy is up only 0.3 percent from a year ago.

The good news for the PPI didn't end at the finished goods level. Prices of intermediate goods decreased 0.1
percent and nonfood, nonenergy goods were unchanged. At the crude materials level, prices jumped 3.7
percent after dropping 9.6 percent, but this was due to a pick up in the volatile food and energy components.
Excluding these, crude goods prices fell 0.5 percent, putting the year-on-year drop at 9.4 percent. Lower year-
on-year prices in the earlier stages of processing suggest that inflationary pressures are not in the pipeline.
This will help Federal Reserve officials maintain a stable policy even with economic recovery. If inflation were a
problem, the Fed would be more inclined to begin tightening as economic activity improves.
Competitive pressures are not giving producers much pricing power and this reduces profit margins. But as
long as costs are in check, profits won't be hurt too badly. Subdued prices will help producers keep costs down.
This should be friendly news for both equity and bond prices.
Retail sales improve
Retail sales decreased 0.2 percent in January, reversing the December gain. This mainly reflected activity in
the auto market that was spurred by zero-interest financing during the fourth quarter. Auto sales could be further
dampened in the next few months since many consumers took advantage of the special deals in the fourth
quarter. This makes the nonauto portion of retail sales even more relevant than usual. In January, sales jumped
1.2 percent after a 0.7 percent hike in December. These are heady figures indeed!

Not to rain on the retail sales parade, it is important to keep in mind that some of the components - such as
gasoline stations - are often affected by price changes more than volume changes in any given month. In the
past several months declining energy prices have dampened the nominal value of gasoline station sales,
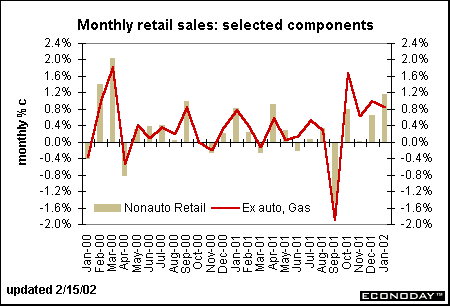
though when adjusted for inflation sales show a pretty good gain. The chart above compares monthly changes
in nonauto retail sales to monthly changes in nonauto retail sales excluding gasoline stations. In January,
gasoline prices increased and this boosted the total. Excluding gas, sales were a bit weaker than the 1.2
percent hike indicated. After all is said and done, the red line, representing nonauto, nongas retail sales, still
shows a pretty good pace of retail spending since the September dive.
Bond investors were probably relieved with the slight dip in the University of Michigan's consumer sentiment
index to 90.9 in mid-February from 93 in January, but the key point is that confidence remains above the fourth
quarter levels and is nearly in line with the 91.5 level posted in August 2001. A slight dip in February confidence
will not necessarily translate into a drop for February retail sales. In fact, weekly chain store data are showing
good improvement in the first half of the month. Consumer spending may not necessarily return to the pace
seen in early 2000, but retail sales could very well continue to post at least moderate gains going forward.


Markets at a Glance • Recap of US Markets • The Economy • The Bottom Line • Looking Ahead
|