
Beneath the surface, payrolls were not strong
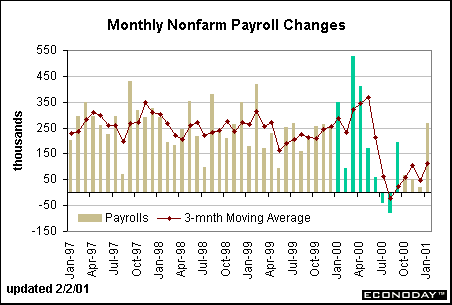
Nonfarm payroll employment jumped 268,000 in January after a downwardly revised gain of 19,000 in December. This is a giant increase in light of the meager gains of the past several months. (The months in green in the chart below reflect payroll figures skewed by temporary Census workers.) But after digging a little deeper than the headline, one realizes that payrolls weren't all that robust.
Construction employment jumped 145,000 in January, after declining in the two previous months. The rise in construction payrolls accounts for more than half of the total gain! Remember that construction was depressed in December because of severe weather in much of the country. Conversely, January was milder and a reversal was merely a correction. A gain of similar magnitude was recorded for construction payrolls last January.
Another special factor that boosted payrolls was a 54,000 gain in government employment. Government payrolls had been down sharply in October and November. We shouldn't necessarily discount the rise entirely, but looking at longer-term trends gives a better picture of the underlying employment growth than just one month's worth of data. The chart below shows a three-month moving average increase of 113,000 in January - probably closer to the true growth path.
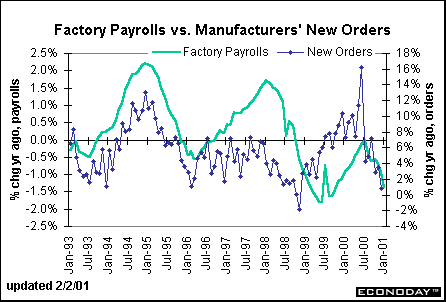
There is no question that the manufacturing sector continues its downward trajectory. Factory payrolls declined 66,000 in January after decreasing 53,000 the previous month. Payrolls are running down sharply from year ago levels - and those were negative too! Factory payrolls move in tandem with factory orders. Factory orders have deteriorated on a year-over-year basis, with the latest gain only 0.8 percent higher than the year earlier. Despite a 1.1 percent rise in factory orders in December, total new orders were down in both the third and fourth quarters of 2000. This bodes poorly for industrial production. The factory workweek did pick up in January, but mainly as a correction to the steep (weather-related) decline in December. The workweek is still down from November. This is not the only report that shows an anemic manufacturing sector. The NAPM survey decreased in January to 41.2, the lowest level since March 1991 when the U.S. was last in recession.
The civilian unemployment rate increased 0.2 percentage points in January to 4.2 percent, the highest rate since September 1999. Household employment grew modestly, but the labor force grew more rapidly, and thus the rise in the jobless rate. The pool of available workers also posted a rise for the month - and in fact has risen steadily these past four months. This means that labor markets are loosening up, diminishing the possibility of wage acceleration. Indeed, average hourly earnings were unchanged in January after posting an average monthly gain of 0.5 percent over the previous three months. This puts the yearly rise at 3.9 percent, lower than November and December.
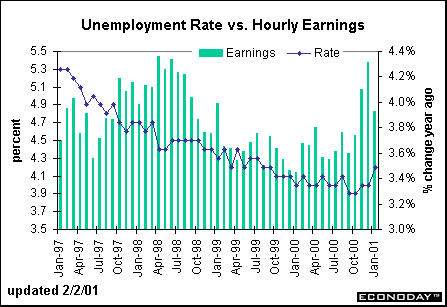
A rising unemployment rate coupled with slower wage gains does not suggest a strong labor market. While the nonfarm payroll figure was certainly a lot stronger than expected, special factors weaken it. The expectations (by market players) of an inter-meeting rate cut may have been premature. But the data is sufficiently weak to justify further easing at the next FOMC meeting.
GDP growth drifts down in Q4
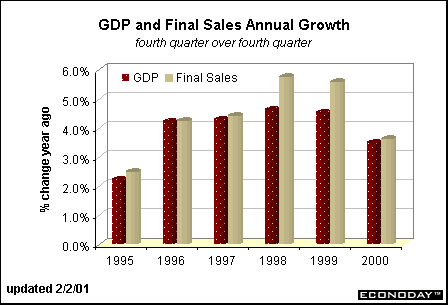
The Commerce Department's advance estimate revealed that real GDP grew at a meager 1.4 percent rate in the final quarter of 2000 after gaining only 2.2 percent in the third quarter. This contrasts sharply with the first half of last year when real GDP grew at a 5.2 percent rate. For the year as a whole, measured on a fourth quarter-to-fourth quarter basis, real GDP expanded a healthy 3.5 percent. But notice from the chart below that this is well below the pace of the previous four years. Notice also that real final sales increased much more rapidly in 1998 and 1999 than real GDP. This suggests that producers could not keep up with demand and inventories were being run down. In 2000, final sales grew at about the same pace as GDP suggesting that demand had softened significantly.
In the fourth quarter, all sectors of the economy declined with the exception of government expenditures. On the consumption front, spending on services accelerated, but spending on nondurable goods was at a meager 0.8 percent rate. Durable goods actually declined at a 3.4 percent rate. Residential investment spending also declined for the second straight quarter - reflecting the downward drift in housing starts. It is well to keep in mind, though, that overall housing activity remains relatively healthy by historical perspective.
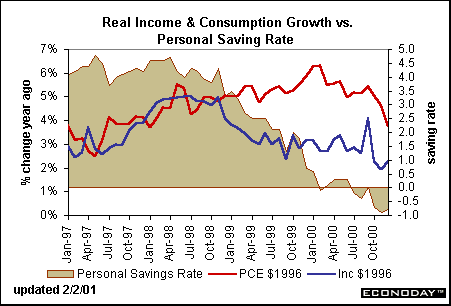
The monthly personal income and consumption report reveals the downward drift in personal consumption expenditures. Income has held relatively steady over the past several months (after accounting for the blip in late 2000 coming from farm subsidy payments). As long as consumption growth exceeds income growth, the personal savings rate will suffer. It remained deeply entrenched in negative territory in the fourth quarter.
Business fixed investment declined at a 1.5 percent rate, the first decline in capital spending since 1992 when the economy was coming out of recession. Investment on equipment and software fell at a 4.7 percent rate, practically reversing the previous quarter's gain. In contrast, investment spending on structures grew at a 9.3 percent rate after expanding at a 14.3 percent rate in the third quarter.
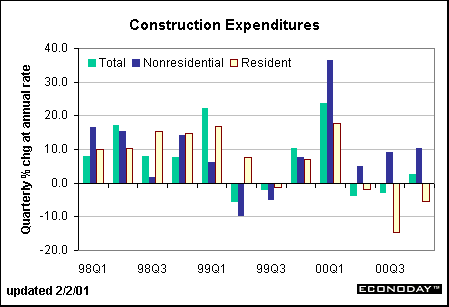
Notice how nonresidential investment spending is contrasting sharply with the residential market. If the economy does weaken, investors may find themselves with overbuilding in the nonresidential sector. In the meantime, this sector continues to outperform the residential market.
The net export deficit widened in the fourth quarter, but the deterioration was smaller than in the third quarter. Exports declined during the quarter, but imports crawled to a standstill. Softer consumer spending typically translates into softer import demand as well since a good chunk of consumer goods are produced overseas. This helps to mitigate the drop in domestic production coming from weaker consumer demand.
The GDP deflator accelerated slightly in the fourth quarter with the chain weighted index rising at a 2.1 percent rate, up from a 1.6 percent rate in the third quarter. However, the pace is still slower than the first half of 2000. Since the GDP deflator is partly dependent on the composition of goods and services produced during the quarter, the higher deflator in the fourth quarter relative to the third was caused by a shift in spending from low-cost goods to higher cost goods. For instance, spending on consumer durable goods and investment spending on equipment and software - where the deflator is negative - declined. But spending increased on consumer services and structures - where the deflator is positive. On the whole, the deflator is not indicative of inflationary pressures in the economy and should not be a source of concern for Fed officials at this time.
New single-family homes surge, but total home sales stable
Sales of new single-family homes surged 13.4 percent in December to a 975,000-unit rate. This does follow a 7.1 percent drop, but puts new home sales 6.4 percent above year ago levels. The housing spurt was surprising for December given the severe weather conditions in most parts of the country. In any case, underlying housing demand reflects the drop in mortgage rates over the past six months.
The chart below compares total single-family home sales (existing home sales fell in December, by the way) to the 30-year conventional mortgage rate. Rates are down just about 150 basis points from their peak in May 2000. Based on a loan amount of $150,000 (about the average for single family homes), the difference in mortgage rates is $155 per month. Wages and salaries rose 3.3 percent between May and December. Even taking into account higher utility bills, the lower mortgage rates pretty much explain the healthy housing market.
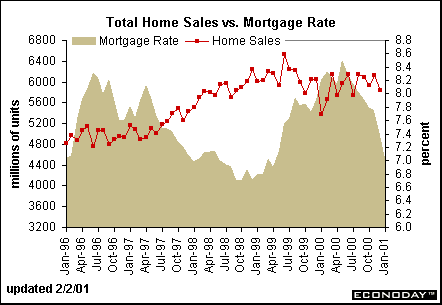
On the whole, the housing market has fluctuated in a narrow range in 2000. This helps maintain some demand for household furnishings and appliances. However, sales aren't galloping at the pace seen in 1998 and 1999, and neither will retail spending on household durables in the next few months.


Markets at a Glance • Recap of US Markets • The Economy • The Bottom Line • Looking Ahead
© Econoday, 2000-2001. All Rights Reserved.
|