 |

Consumer starting to recover
Retail sales inched down only 0.1 percent in December after a sharp 3 percent drop for November. Remember that auto sales skyrocketed in October
due to zero-percent financing, causing retail sales to surge 6.4 percent for the month. The subsequent declines in auto sales were pretty minor since
incentives continued to run through the end of the year. Nonauto retail sales decreased 0.1 percent in December after a 0.2 percent drop in November.
But the weak pace of non-auto retail sales is misleading for the October to December period because sales at gasoline stations fell sharply in each of
the three months - mainly due to price declines.
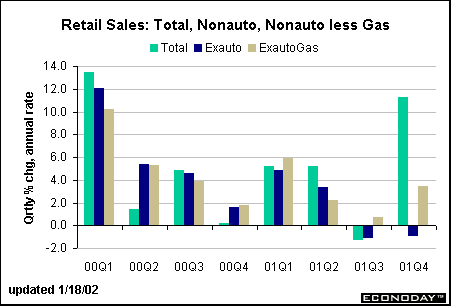
The chart above compares quarterly changes in total retail sales, nonauto sales, and nonauto sales excluding gasoline. Notice that nonauto sales
excluding gasoline did rise at a 3.5 percent annual rate in the fourth quarter. Since GDP is conventionally analyzed in real terms (after inflation
adjustment), we will see a pretty hefty gain in personal consumption expenditures in the fourth quarter after the meager pace posted in the third quarter.
While it is certainly too early to call the end of the recession, continued gains in consumer spending will go a long way in boosting economic activity.
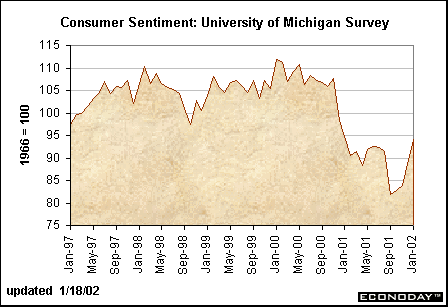
The University of Michigan's consumer sentiment survey showed another rise in its consumer confidence index for early January. The index has a long
way to go to recover the lost ground of the past year, but it does appear that consumer attitudes are improving. This will help retail spending in coming
months.
Judging by the chart below, the housing market was pretty stable over the past year. Fluctuations were concentrated in a tight range. Starts did fall 3.4
percent in December but this was entirely due to the multi-family sector, which can cause sharp swings from month-to-month. Starts of single-family
homes increased 3.6 percent in December on top of a 1.9 percent gain in November. Single-family construction has also fluctuated in a narrow range.
Given the fact that the economy was in recession, housing activity remained remarkably resilient. (Yes, we say that every month but it's true!)
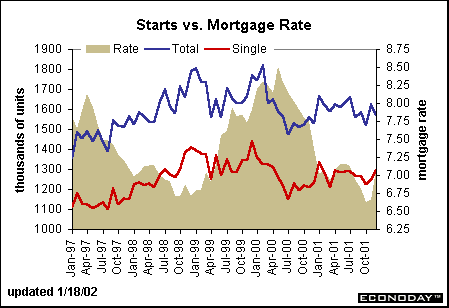
The firm housing market in 2001 limited the depth of the recession. However, a typical recovery is marked by a solid rebound in the sector as
households react to declining interest rates. Most economists are not predicting declining interest rates this year. In fact, it is likely that the lowest
Treasury and mortgage rates have already been seen for this cycle. Consequently, the 2002 recovery is likely to be more modest than most since it
won't get the spurt from housing.
How low can it go?
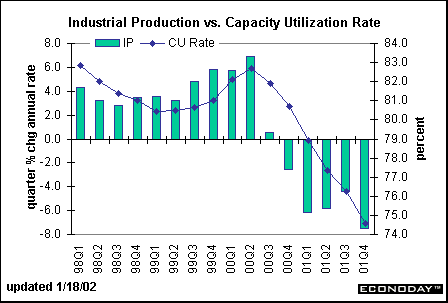
The index of industrial production edged down 0.1 percent in December, the smallest monthly drop in five months. Nevertheless, industrial production
declined at a 7.5 percent rate in the fourth quarter, the largest quarterly drop for this cycle. While the quarterly numbers do look pretty miserable, the
quarter ended better than it started in some sectors. The market groupings show that automotive products (spurred by incentives), home electronics,
and appliances, carpet & furniture improved dramatically in November and December. High-tech industries are starting to mend as well. Production of
semiconductors and related electronic products posted increases from September through December. Some hopeful news came from the
Philadelphia Fed's business outlook survey. Its general activity index posted a gain in January that pushed the level well over the zero mark. This index,
which does a fairly good job of predicting industrial production, points to a rise in production for January.
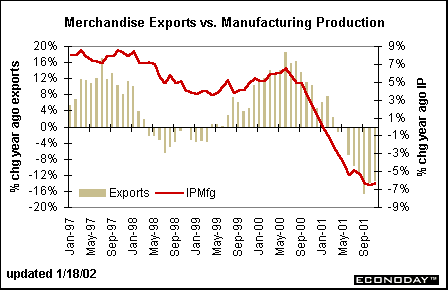
There is no question that domestic production has been dampened further by the weakness overseas. The chart below compares year-over-year
growth rates in merchandise exports with manufacturing production. Notice the strong correlation between the two series during 2000 and 2001. Even
in 1998 and 1999, U.S. production was hampered by declines in exports.
International trade deficit narrows
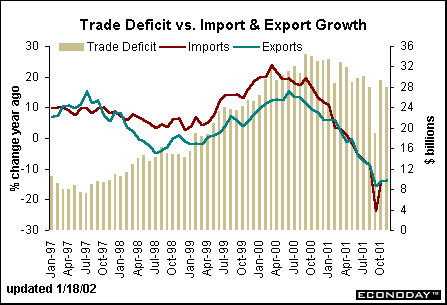
The international trade deficit on goods and services narrowed in November to $27.9 billion after posting a $29.3 billion shortfall in October. Exports
rose modestly for the second straight month, but imports declined slightly in November. Nevertheless, both were down sharply, again, on a year-over-
year basis, but the declines were smaller than a few months ago. The U.S. bilateral trade deficits with Canada and Mexico were unchanged from
October levels, but the deficit with Western Europe narrowed, as did the deficit with Pacific Rim countries. Through November, the deficit as measured
by the Census Bureau is down 4.6 percent from last year. If export demand improves in the next couple of months, there is no question that it will spur
industrial production in the United States.
Inflation was tame in 2001
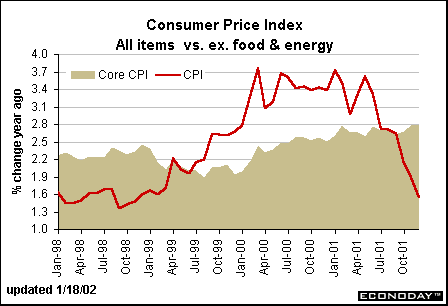
The consumer price index fell 0.2 percent in December, dampened by a 3.2 percent drop in energy prices. This was the third straight decline in energy
prices, which dropped 4.6 percent over the three-month period. Consequently, the CPI posted a year-over-year gain of 1.6 percent in 2001, the best
showing since the same 1.6 percent rise in 1998. Economists have hounded market participants and the financial media into following the CPI
excluding food and energy prices, also known as the core CPI, because monthly variations in food and energy prices often distort underlying inflation
trends. Thus, many financial market players virtually ignored the 1.6 percent inflation rate and focused on the 2.7 percent gain in the core CPI. In fact,
consumers spend roughly 25 percent of their monthly budget on food and energy. What is more "core" than that? Looking at annual inflation rates, one
needs to consider the whole, not just specific components. As such, the total CPI does a good job of measuring overall inflation from 2000 to 2001.
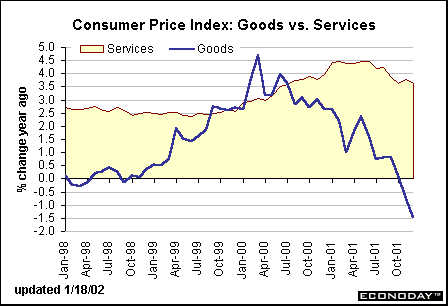
In order to gauge the direction of potential inflationary pressures, it is useful to look at the breakdown in prices between goods and services. Prices of
goods do include food and energy, but also durable goods and high tech equipment that have shown significant downside tendencies over the past
two years. There was never any danger of seeing deflation emerge because goods account for less than 45 percent of the total CPI and prices of
services don't tend to decline. The rate of inflation did moderate for services in 1998 and 1999, but started to accelerate again in 2000. Notice that
yearly changes in prices of services are starting to moderate once more. The moderation is slow even during economic recession and occurs with a
lag. Consequently, it is likely that prices of services may still moderate on a year-over-year basis going forward into 2002. The bulk of the energy price
declines are probably behind us. Even with price declines for high tech goods, goods prices may stabilize this year.
|  |


Markets at a Glance • Recap of US Markets • The Economy • The Bottom Line • Looking Ahead
|
 |