| Previous Articles |
|
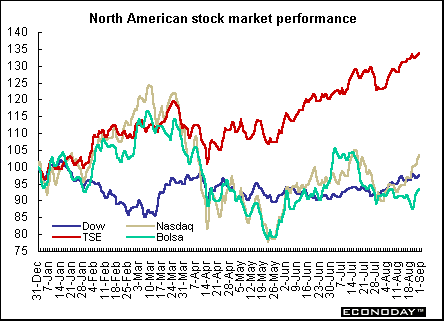
Wither the euro... Pre-Labor Day weekend is a good time to take a look at market performance so far this year. Of the markets tracked here, the Toronto Stock Exchange composite 300's performance continues to outshine the rest. While overseas markets look to the Dow and Nasdaq and the U.S. economy for leadership, home grown events still dominate. On the week, both the Paris CAC and the TSE composite 300 set new highs.
Europe
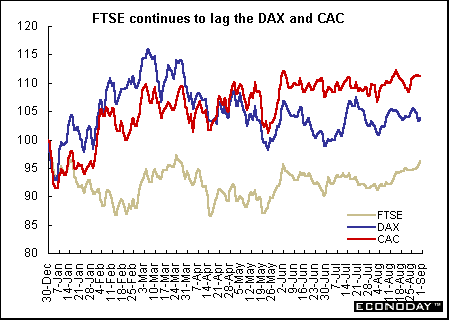
However, economic performance and equity market performance have not exactly followed the same trend. The Paris CAC has outperformed both the Frankfurt DAX and the London FTSE 100. The CAC is up 11.2 percent since January 1 setting many new records on the way (as it did on Friday). The Frankfurt DAX has risen above its 1999 year end average and is now up 3.71 percent. Technology and telecommunication stock strength along with mergers are the driving force. The London FTSE 100, although it gradually pulled back to its January 1 level during August, it is still 3.72 percent below that mark. Investors continue to rotate between old and new economy stocks. In the latter category are the TMT's - telecommunications, media and technology stocks. The FTSE is down 3.72 percent since January 1. The data reflect the indexes' positions on August 31, 2000. Asia
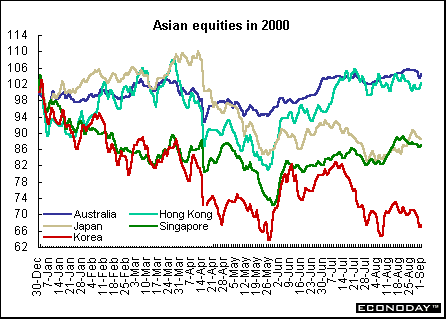
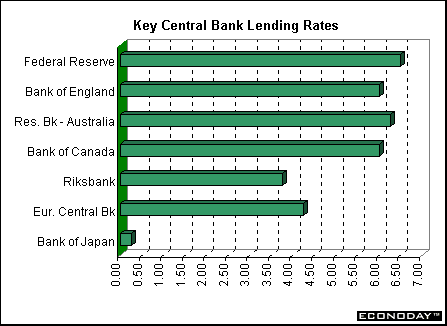
In Japan, the equities markets followed the debates with rapt attention whether the Bank of Japan should end its zero interest rate policy. The bank did, and investors responded nervously as they wondered whether the 25 basis point rate increase would sabotage the nascent Japanese economic recovery. Although the rhetoric has calmed down, the unease remains as economic data show a less than stimulated economy. The Nikkei 225 is down 10.75 percent since January first. Of the Asian markets covered here, the Australian all ordinaries is the best performer, up 5.2 percent. The South Korean kospi is the worst performer this year, plummeting 30 percent since January 1. The Singapore straits index is down 12.67 percent. Americas
Currencies
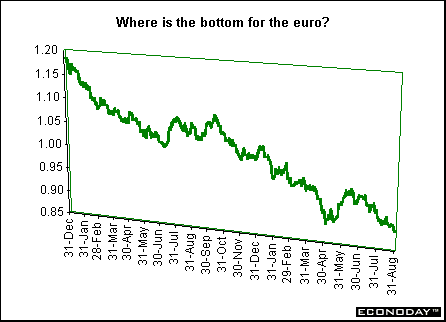
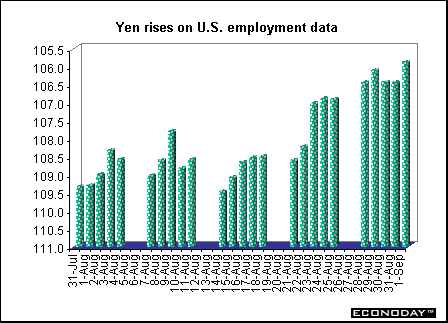
While the prospect of higher interest rates typically supports a currency by making deposit rates more attractive to international investors, a greater concern is that higher borrowing costs will cut into corporate profits and hurt stocks and bonds. Indeed, that was the markets' reaction to Thursday's 25 basis point interest rate increase. The euro's decline came even as German second quarter gross domestic product grew at the fastest pace in more than two years. (See indicator scoreboard below.) Still, those data followed a disappointingly weak business confidence survey last week, which sparked concern growth may be peaking. These concerns were heightened when additional data suggested that French and German growth was hesitating this summer. The yen rose to an eight week high against the dollar as traders sold euros through dollars to buy the Japanese currency. Japan's currency was also helped initially by optimism that economic data would show continued signs of recovery. However, the data disappointed and the yen began to slide in value. Still, investors are expecting second quarter gross domestic product (released in early September) to show 0.9 percent growth after a 2.5 percent increase in the previous quarter. The caveat here is that the data are notoriously unreliable and subject to large revisions. The yen has remained in a narrow range, although on Friday it broke through the 106 dollar-yen barrier after the weak U.S. employment report.
European Central Bank ups interest rates The reasons for the increase were the euro's decline and higher oil prices, which have contributed to emerging inflation risks. July's inflation rate was 2.4 percent, overshooting the ECB's 2 percent target for a second straight month. The cost of imported goods, particularly dollar denominated raw materials, has risen as the euro declined. Oil prices have tripled in the last 18 months, further fanning inflation.
Indicator scoreboard Europe
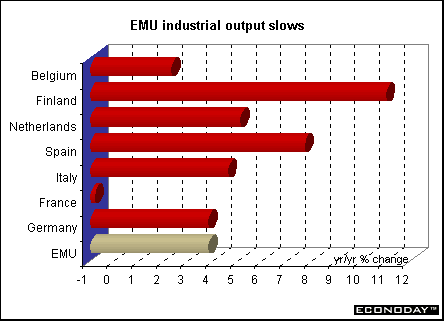
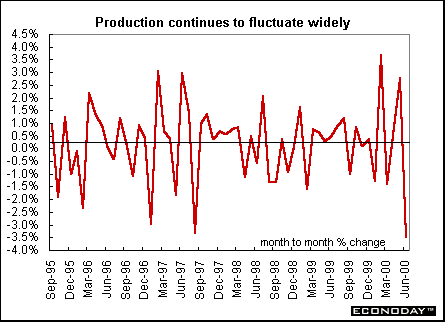
June industrial production fell 0.4 percent on the month but rose 3.8 percent when compared with last year. It was noted that public holidays were celebrated in several member countries in the middle of the week so that workers may have taken several bridging days for long weekends, influencing the result. All EMU countries reported annual increases in output except for Portugal (-1.9 percent) and France (-0.8 percent). The strongest annual growth rates were recorded in capital goods (6.1 percent), consumer durables (5.2 percent), intermediate goods (3.6 percent) and nondurable consumer goods (2.3 percent).
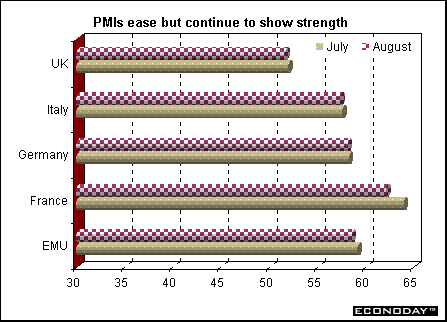
Reuters seasonally adjusted purchasing managers' index fell to 58.6 in August from 59.2 in July. It is the fourth straight month that the index has decelerated, suggesting that manufacturing activity has peaked. The index is based on data from Germany, France, Italy, Spain, Ireland and Austria. An index level above 50 indicates the manufacturing sector is expanding, while a level below 50 indicates contraction. The higher the index above 50, the stronger sector growth. The prices index, which is not part of the overall PMI, fell to 67.1 in August from 72.0 in July.
Germany - Second quarter seasonally adjusted gross domestic product rose 1.1 percent from the previous quarter after increasing 0.8 percent in the first quarter, according to Bundesbank data. Consumer spending rose 1.3 percent, the biggest gain since the first quarter of 1999. Exports jumped 3.1 percent, thanks to the euro's decline. The economy grew 3.6 percent when compared with a year earlier, the fastest pace since records for a reunified German began in 1991. Second quarter capital goods investment fell 1.2 percent.
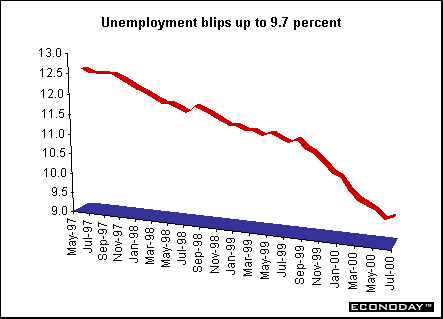
France - July unemployment rate rose to 9.7 percent according to the International Labor Organization definition, which excludes job seekers who did any work during the month. In July 1999, the unemployment rate was 11.2 percent.
June seasonally and workday adjusted manufacturing output fell 0.8 percent. Results for previous months were also revised down slightly. All manufacturing sectors declined except for capital goods, which were up 0.3 percent. Declines were led by the auto industry, which dropped 2.0 percent. Italy - July producer prices rose 0.5 percent on the month and 6.6 percent when compared with last year because of higher energy import prices and the weak euro. Intermediate goods increased 0.8 percent. Oil products rose 0.9 percent on the month, while a strong increase was also reported for the electricity, natural gas and water tariffs, up 2.6 percent. Spain - July non-seasonally adjusted producer prices rose 0.2 percent and 5.5 percent when compared with last year. Energy prices rose 0.9 percent on the month and 23.3 percent on the year. Producer prices for intermediate goods - the category in which energy prices are listed and which accounts for almost half (about 47 percent) of the weighting in the producer price index - rose 0.2 percent on the month and 10.9 percent on the year. Asia
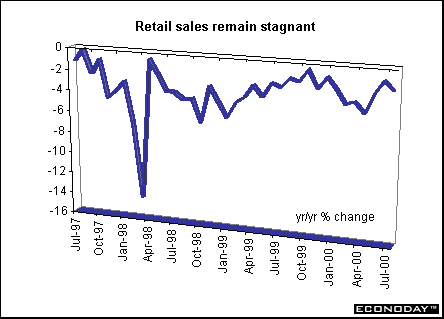
July seasonally adjusted spending by households headed by a wage earner increased 0.3 percent. Salaried workers' income rose 2.6 percent after falling 6.3 percent in June. Spending fell 3.6 percent when compared with last year. July retail sales fell 0.5 percent on the year while large stores retail sales fell 3.3 percent and were down 4.9 percent when adjusted for store closings and new stores. Total sales were down 2.0 percent on the year while wholesale sales fell 2.5 percent.
July seasonally adjusted industrial production fell 0.7 percent but rose 4.4 percent on the year. Transport equipment, general machinery and fabricated metals dropped while personal computers rose. Shipments fell 1.7 percent on the month and rose 4.7 percent on the year while inventories were down 0.1 percent on the month and down 1.0 percent on the year. Americas
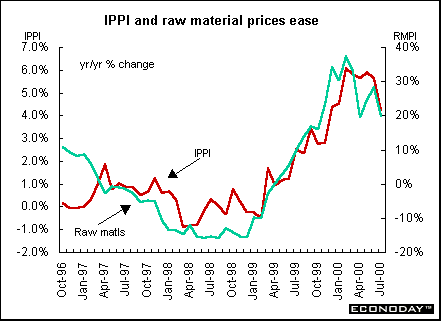
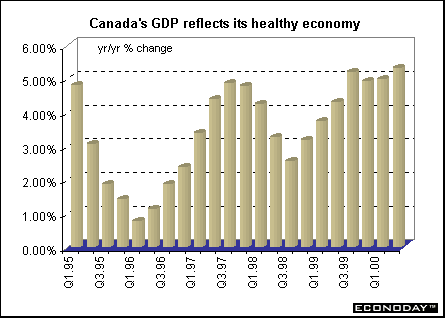
July raw materials price index (RMPI) declined 2.4 percent as weaker crude oil, log and cattle prices more than offset stronger hog and non-ferrous metal prices. When compared with a year ago, the RMPI was up primarily because of higher mineral fuels and animal product prices. This is a deceleration from the 28.3 percent rise in June. If mineral fuels were excluded, the annual increase in the RMPI would have been only 5.5 percent instead of 19.9 percent. If mineral fuels were excluded from the monthly calculation, the drop in the RMPI would have been less dramatic, slipping 0.4 percent. Second quarter seasonally adjusted gross domestic product rose 1.1 percent and at a 4.7 percent annual rate. This was the 20th consecutive quarterly GDP increase. Final domestic demand rose 1.2 percent in the second quarter from the previous three months. The implicit price index rose 0.6 percent, while the chain price index rose 1.4 percent. Second quarter personal spending on goods and services was up 0.9 percent; government current spending on goods and services, up 0.2 percent; business gross fixed capital formation, up 2.6 percent; exports of goods and services, up 2.1 percent; and imports of goods and services were up 2.5 percent.
June seasonally adjusted gross domestic product at factor cost rose 0.4 percent. Compared with a year earlier, June GDP was up 4.7 percent. Manufacturing output remained strong, rising 0.7 percent on the heels of a strong 1.8 percent gain in May, as foreign demand for electrical and electronic goods and motor vehicle parts remained robust. The rest of the increase was attributable to higher wholesaling, business services, and telecommunications services. In total, 13 of 22 major industry groups, accounting for almost 90 percent of total manufacturing production, advanced in June. BOTTOM LINE
Release dates are subject
to change. |
|||||||||||||||||||||||||||||||||||||||||||||||||||||||||||||||||||||||||||||||||||||||||||||||||||||||||||||||||||||||||||||||||||||||||||||||||||||||||||||||||||||||||||||||||||||||||||
