| Previous Articles |
|
Strong
economic data give central bankers something to think about
Aside from important economic data, earnings reports and warnings of slower future profit growth burdened the markets. Because of the weighting mechanisms used to calculate the indexes, strong movements in a few stocks frequently have a disproportionate impact. This was undoubtedly the case last week in Toronto and Frankfurt. What was bad for the equity markets, however, was good for the dollar. The dollar rose against most of the major currencies including the euro and yen.
Britain
and Europe
The Frankfurt DAX continues to be affected by the offs and ons in merger activity. Another banking merger was canceled in Germany, where such combinations seem troublesome, while a telecommunications merger was proposed. And as data showing higher inflation were released (see Indicator scoreboard below), new worries surfaced about interest rates. It had been assumed that the European Central Bank would wait until after their August vacation to raise rates, but now market players weren't so sure. Yet according to most, the odds hold that the ECB will leave rates unchanged at their Thursday meeting. The DAX closed down 244.96 points or 3.32 percent at 7128.30. The Paris CAC slid on earnings reports and the Concorde plane crash. However, the economic reports from France continue to be positive. As in Frankfurt, the upcoming ECB meeting could distract Paris, although nothing is expected to happen. The CAC was down 48.4 points or 0.75 percent to end the week at 6415.72. Both the CAC and DAX are slightly above their 1999 year end levels while the FTSE continues to be lower. Asia The Nikkei declined for a variety of reasons. Investors continue to be concerned about the economy following recent high profile bankruptcies. As revealed by the new economic data (see indicator scoreboard below) the nature of the economic recovery has been uneven at best. This clouds the question of whether the Bank of Japan will raise interest rates from near zero as they keep threatening to do. The Nikkei ended the week under the psychologically important 16,000 level at 15,838.57, down 972.92 points or 5.79 percent.
In other markets, the Hong Kong Hang Seng dropped 726.93 points or 4.11 percent to close out the week at 17,183.93. The South Korean Kospi fell 90.41 points or a sharp 11.55 percent to end the week below the 700 level at 692.65. Only the Hang Seng and the Australian all ordinaries are above 1999 year end levels. Currencies
The euro was particularly pressured on Thursday and Friday by strong data that showed the U.S. is still growing faster than expected. Market players had decided that the growth gap between the United States and the European Monetary Union was closing making Europe more attractive for investors. Last week's data put at least a temporary end to that speculation and once again raises the specter of higher U.S. interest rates on August 22. This would also put an end to expectations of a narrower interest rate spread between the EMU and the U.S. The yen hovered near a nine week low against the dollar amid concern a series of Japanese corporate bankruptcies are a sign the economic recovery may stall. That could further sap demand for Japanese stocks and the currency needed to buy them. Japanese bankruptcies rose more than 20 percent in June when compared with a year earlier, This was the eighth straight increase in the bankruptcy rate, and more companies are expected to fail in coming months. And adding to investors' uncertainly, rating agency Moody's Investors Service has had Japan's credit under review for a possible downgrade since February.
The verdict on the Japanese expansion continues to be mixed (see indicator scoreboard). The data highlights the fact that the U.S. economy is still strong and brings into relief the contrast with the Japanese economy, which is still iffy at best. Indicator
scoreboard
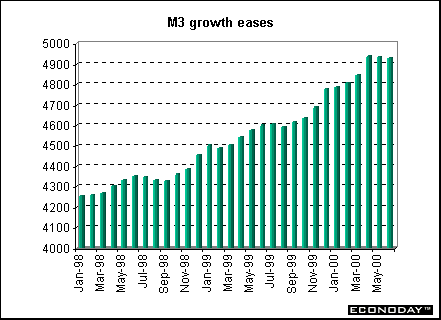
June M3 money supply and private sector credit growth decelerated for the second straight month. June seasonally adjusted M3 contracted 0.3 percent - only the second time a contraction has occurred since the ECB began to publish this statistic. When compared with last year, M3 rose 5.4 percent in June, lower than the unrevised 5.9 percent in May. The three month (April to June) moving average of 12 month rates fell to 6.0 percent from 6.4 percent in the March to May period. The three-month moving average, which is used by the ECB as one of its main monetary policy guides, is 150 basis above the ECB's 4.5 percent monetary growth reference value.
Germany - May revised seasonally and price adjusted industrial production rose 2.8 percent on the month, up from the 2.2 percent increase originally reported. Manufacturing output rose a revised 2.6 percent on the month mainly due to strong increases in basic goods. Capital goods production increased 2.3 percent. In west Germany, output rose a revised 2.7 percent on the month, and in the east, output was revised up to 2.4 percent. June import prices rose 0.1 percent on the month and 11.5 percent on the year. The increase was caused mostly by a rise in oil prices, offset slightly by declining capital goods prices. Import prices excluding oil products fell 0.4 percent but were up 6.2 percent on the year. Seasonally adjusted import prices rose 0.4 percent in June and were 11.5 percent above last year. June seasonally adjusted export prices remained unchanged but climbed 3.6 percent on the year, after rising 0.7 percent on the month and 3.8 percent on the year in May. June producer prices climbed 0.3 percent and 2.9 percent when compared with last year. Surging oil prices were again the driving force behind the overall rise in PPI. They jumped 4.7 percent on the month and 34.6 percent when compared with last year. Excluding oil products, producer prices rose 0.2 percent on the month and by only 1.7 percent on the year. Seasonally adjusted PPI rose by 0.4 percent on the month and by 3.1 percent when compared with last year. Excluding energy, the PPI rose 0.1 percent on the month and 2.0 percent on the year.
July preliminary seasonally adjusted consumer prices for the six months to July rose at an annualized rate of 1.9 percent. Seasonally adjusted prices were up 0.1 percent on the month and up 1.8 percent on the year, compared to the unadjusted rise of 0.4 percent on the month and annual increase of 1.8 percent. France -June seasonally adjusted unemployment rate fell by 0.2 percent to 9.6 percent, according to the ILO definition, which excludes job seekers who did any work during the month.
Italy - April employment in large industrial firms contracted by 2.3 percent when compared with last year, but the number of large firm service sector jobs rose 0.1 percent. The data confirms the long running trend in which most new employment is being created among small and medium sized service sector companies, while large industrial firms, in particular, are steadily shedding jobs. June non-EU merchandise trade surplus was L210 billion after a deficit in May of L434 billion. Non-EU imports were up 40.8 percent when compared with last year while exports rose by 14.6 percent. High oil and commodities imports prices had eaten into the surplus. The May trade deficit with its EU trading partners was L813 billion (EU trade data are reported a month behind that for non-EU trade). Exports to the EU rose 20.2 percent from May 1999 and imports were up 22.9 percent. May world trade deficit stood at L1.246 trillion, with imports rising 37.8 percent when compared with last year and exports were up 25.7 percent. Britain - June merchandise trade deficit with countries outside the European Union widened in June as strong growth in the value of imports continued to out pace that of exports. The non-EU deficit widened to Stg2.089 billion in June from Stg1.798 billion in the previous month. Exports to non-EU countries were up 2.0 percent while imports jumped 5.0 percent. The May global goods deficit narrowed slightly to Stg2.539 billion compared with Stg2.631 billion in the previous month. July business confidence in the manufacturing sector fell at the fastest rate since January last year. Order books also showed further deterioration according to the quarterly industrial trends survey of the Confederation of British Industry. The survey shows that the business confidence balance fell to -10 percent in July from -2 percent in April. Manufacturers' optimism about their export prospects also weakened sharply. Asia June retail sales fell 1.1 percent on the year while large stores retail sales fell 2.2 percent and were down 4.4 percent when adjusted for store closings and new stores. Total sales were up 0.7 percent on the year while wholesale sales rose 1.2 percent.
June seasonally adjusted unemployment rate rose to 4.7 percent from 4.6 percent in May. The number of employed decreased by 0.2 percent while the number of unemployed fell 2.4 percent on the year. The labor force participation rate was 63.0 percent. The number of workers employed by small businesses continued to fall, dropping by 0.6 percent on the year. But those employed by large companies (those companies employing more than 500 people) climbed 1.9 percent, gaining for the ninth straight month.
June spending by wage earners was down 2.6 percent in real terms from a year earlier, suggesting that improvement in the corporate sector has yet to spark a recovery in consumption. The propensity for wage earners to consume, a ratio which measures the amount of disposable income that went to household spending, edged up to 73.2 percent from 72.9 percent in May on a seasonally adjusted nominal basis. July Tokyo consumer price index was down 0.2 percent on the month and down 0.9 percent on the previous year. In all of Japan the June CPI fell 0.3 percent and was down 0.7 percent on the previous year. June seasonally adjusted industrial production rose 1.7 percent and jumped 7.0 percent when compared with last year. Shipments rose 2.5 percent on the month and 7.5 percent on the year while inventories were down 0.1 percent on the month and down 0.8 percent on the year. Hong Kong - June consumer prices dropped 4.5 percent when compared with last year. June's fall was the 20th straight monthly decline, and kept pace with the drop in May Australia - Second quarter consumer price index rose 0.8 percent and 3.2 percent when compared with a year earlier. Inflation breached the Reserve Bank's 2 to 3 percent target band for the first time since June 1996. The data confirms rising inflationary pressures, largely stemming from a weaker Australian dollar, higher oil prices, and continuing strong growth.
Americas
June raw materials prices rose 2.1 percent and 28.3 percent when compared to last year primarily because of higher prices for mineral fuels. If mineral fuels were excluded, the year over year increase in the RMPI would have been only 6.3 percent instead of 28.3 percent. On a month to month basis, the index would have declined 1.8 percent instead of increasing 2.1 percent. BOTTOM
LINE
Release dates are subject
to change. |
|||||||||||||||||||||||||||||||||||||||||||||||||||||||||||||||||||||||||||||||||||||||||||||||||||||||||||||||||||||||||||||||||||||||||||||||||||||||||||||||||||||||||||||||||||||||||||||||