
Indicator scoreboard
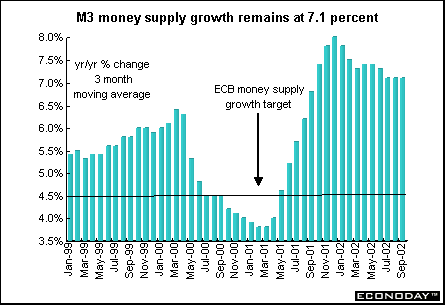
EMU - October M3 money supply rose 0.5 percent and 7.0 percent when compared with last year. The moving average for the three months to October rose 7.1 percent when compared with the same three month a year ago. The moving average remains well above the ECB's target of 4.5 percent M3 money supply growth for this year. However, the ECB has said that high M3 growth does not pose an inflation risk at the moment given weak economic growth.
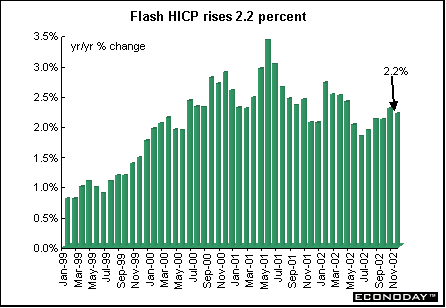
November flash harmonized index of consumer prices rose 2.2 percent when compared with last year. This was below October's HICP of 2.3 percent. In order to compute its HICP flash estimates, Eurostat uses early price information provided by Germany, Italy and - if available - by other member states, as well as early information about energy prices. The HICP is more vulnerable to energy price changes than the U.S. CPI.
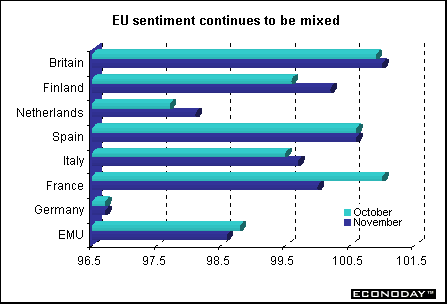
EU - November economic sentiment index declined to 98.6 from 98.8 in October. This was the second decline in a row and the fifth in the last six months. Drops in consumer and construction sentiment more than offset gains in industrial and retail confidence. The consumer confidence index fell to minus 14 from minus 12 in October, while construction sentiment fell to minus 25 from minus 23 a month earlier. Consumer confidence fell to its lowest level since July 1997. However, industrial sentiment rose to minus 10 from minus 11 in October, thanks to increased production expectations.
France - October producer prices edged down 0.1 percent after three months of gains, as lower agricultural and consumer goods prices offset a weaker boost from energy. When compared with last year the PPI was up 0.6 percent. Energy price increases slowed markedly, posting a 0.2 percent rise after a 1.8 percent gain in September. Excluding energy and agriculture, the core PPI was unchanged on the month and was 0.4 percent higher on the year.
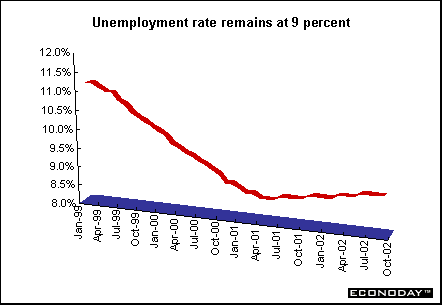
October unemployment declined by 6,000, leaving the International Labour Organization jobless rate steady at 9.0 percent for the fifth month. The decline trimmed the number of jobless to 2.424 million, up 3.7 percent on the year, according to the ILO definition that excludes jobseekers who did any work during the month.
Italy - September unadjusted retail sales were unchanged but fell 0.2 percent when compared with last year. Analysts do not closely watch the retail sales data because they show no correlation with consumer spending as published in quarterly GDP statistics. Starting with the January 2003 release, however, the index will be rebased, with a new 2000 base year to replace the current 1995. The new index will boost the weight of large retail outlets, which will make up some 23 percent of the index instead of 16 percent under the current index.
October producer prices rose 0.2 percent and 1.1 percent when compared with last year. Excluding energy, the PPI was down 0.2 percent but rose 1.1 percent on the year. Intermediate goods prices rose 0.4 percent and 0.7 percent on the year.
Britain - Third quarter gross domestic product was revised upward from previous estimates to 0.8 percent and 1.8 percent when compared with last year. The upward revision was due to higher service sector output, which was revised up to 0.9 percent from 0.8 percent originally reported and is up 2.3 percent from a year earlier. Household spending rose 0.8 percent on the quarter and by 3.8 percent on the year. Government expenditure rose 1.3 percent on the quarter and by 3.2 percent on the year. Investment in the latest quarter dropped 2 percent, to stand 6.7 percent below levels a year earlier.
Asia
Japan - October seasonally adjusted merchandise trade surplus jumped to ¥905.4 billion from ¥609 billion in September. Exports rose 8.5 percent and imports rose 1.6 percent. When compared with the previous year, the surplus jumped 95.6 percent. However, the data from 2001 were distorted by the September 11th terrorist attacks.
October nationwide retail sales fell for the 19th straight month, dropping 2.8 percent from a year earlier. Retail sales at large stores fell 1.9 percent on a same-store basis when compared with last year. Sales in September fell 0.7 percent on the year.
October seasonally adjusted industrial production fell 0.3 percent but was up 5.3 percent when compared with last year. Production of chip making equipment, printing machines, chemicals and transport products (such as ships and cars) fell, contributing to a second straight month of total production declines.
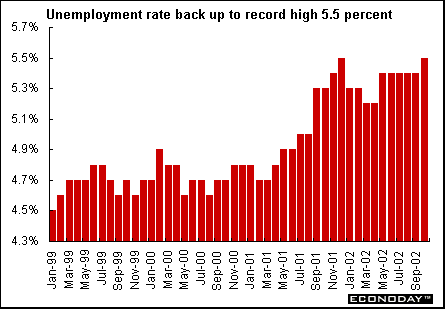
October unemployment rate rose to 5.5 percent showing labor market conditions remain severe amid relentless corporate restructuring. The unemployment rate had been stuck at 5.4 percent since May. The number of unemployed rose to 3.7 million. There were 56 jobs per 100 applicants in October, up from 55 in September.
October real spending by wage earners fell 0.7 percent after rising 4.1 percent in September. Wage earner spending is an important gauge of personal consumption, which accounts for roughly 55 percent of Japan's gross domestic product. Spending is especially crucial now, as export growth - the primary engine of Japan's recovery earlier this year - is cooling, leaving the economy dependent on consumers for growth. The seasonally adjusted nominal propensity for wage earners to consume, a ratio that measures the amount of disposable income that went to household spending, fell to 72.7 percent from 75.0 percent in September.
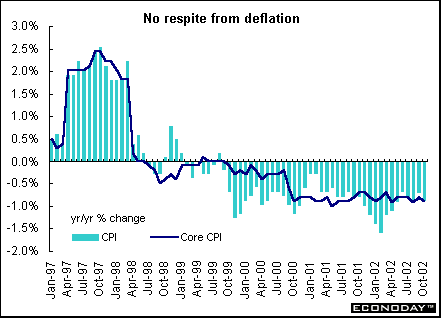
October nationwide consumer price index fell 0.2 percent and 0.9 percent from a year earlier. This marks the 37th straight drop and underscores that the nation remains in the grip of deflation. Nationwide core CPI fell 0.1 percent and 0.9 percent when compared with last year. Since March 2001, the central bank has used the nationwide core CPI as its price indicator.
Americas
Canada - October industrial product price index (IPPI) rose 0.4 percent and 2.4 percent when compared with last year. This was the largest increase since May 2001. Higher prices for petroleum and coal products, motor vehicles and other transport equipment and meat, fish and dairy products had a major impact. Lower prices for chemical products and primary metal products partly offset these monthly increases.
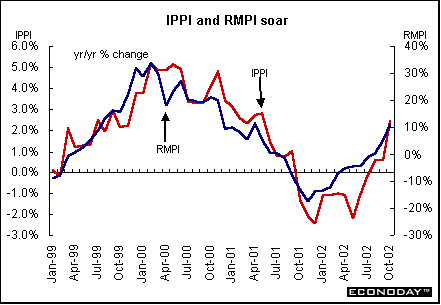
October raw materials price index (RMPI) slipped 0.1 percent but soared 11.1 percent when compared with last year. Higher prices for mineral fuels and vegetable products as well as for wood products and non-ferrous metals were mainly responsible for the jump. These increases were partly offset by lower prices for animal products. If mineral fuels had been excluded, the RMPI would have increased 5.7 percent on the year.
In October, the value of the U.S. dollar against the Canadian dollar was virtually unchanged, having no impact on the prices of commodities that are quoted in U.S. dollars. As a result, the total IPPI excluding the effect of the exchange rate remains the same at 0.4 percent. However, on a 12-month basis, the influence of the dollar had more of an impact. The IPPI was up 2.4 percent from October 2001 to October 2002, but without the exchange rate effect the IPPI would have increased 1.9 percent.
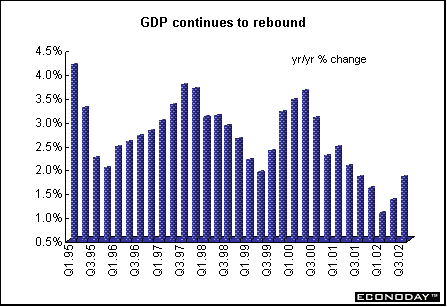
Third quarter gross domestic product jumped 0.8 percent and 4.0 percent when compared with last year. GDP advanced on strength in new housing activity and exports. Consumer spending remained flat and business capital spending slowed. Domestic demand - combining consumer, business and government spending - slowed to about half the pace of the second quarter, despite high housing market activity. Consumer spending edged up 0.1 percent, after having grown nearly 1 percent in each of the three last quarters. Business investment in plant and equipment climbed 0.5 percent, compared with a 2.2 percent jump in the second quarter. Exports posted the strongest gain in 10 quarters, up 2.3 percent, which reflects the strength of consumer spending on motor vehicles and parts in the United States.
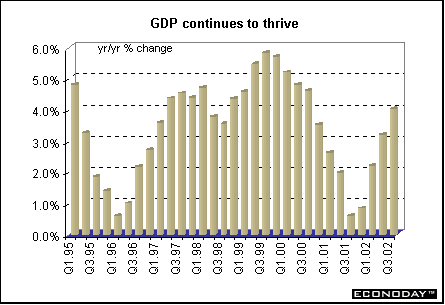
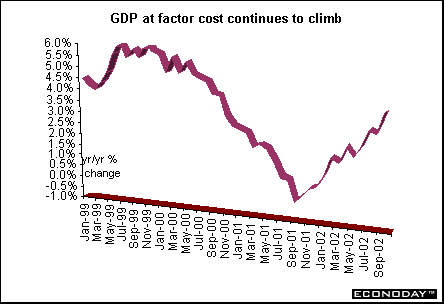
September gross domestic product at factor cost edged up 0.1 percent and jumped 4.1 percent when compared with last year. This was the 12th consecutive monthly increase. Increased purchases of new and existing housing and higher industrial production offset weakness in agriculture, finance and wholesale trade. On the year, these data should be viewed with caution - the data from 2001 were distorted by the September 11th terrorist attacks.


Last Week's Highlights • Global
Stock Market Indexes • Recap of Global Markets
• Currencies • Indicator
Scoreboard

The Bottom Line •
Looking Ahead
|