
Indicator scoreboard
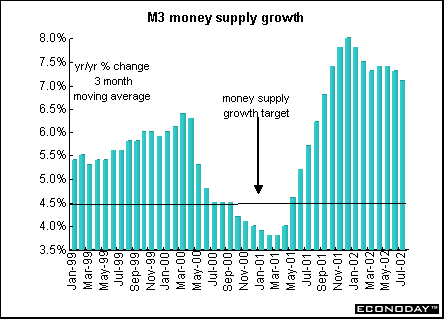
EMU -August seasonally adjusted M3 money supply growth eased to 7.0 percent from 7.1 percent in July. The 3-month moving average for June through August declined to 7.1 percent from an unrevised 7.3 percent for the prior three months when compared with the same months last year. The M3 growth rate remains significantly above the ECB's target 4.5 percent growth rate.
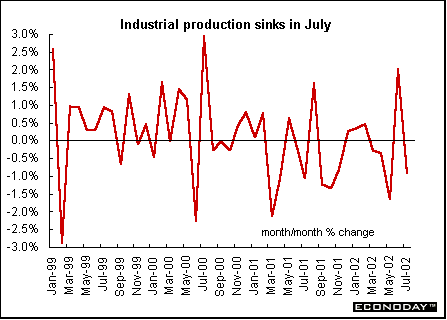
Germany - July seasonally adjusted industrial production was revised to a 0.9 percent decline from the 1.0 percent decline originally reported. Industrial production excluding construction (the figure that Eurostat uses to calculate eurozone industrial output) was revised to a decline of 1.0 percent from the 1.1 percent drop originally reported. Manufacturing output was revised upward to a decline of 0.8 percent with the capital goods output decline cut in half to 0.7 percent from the originally reported 1.4 percent drop.
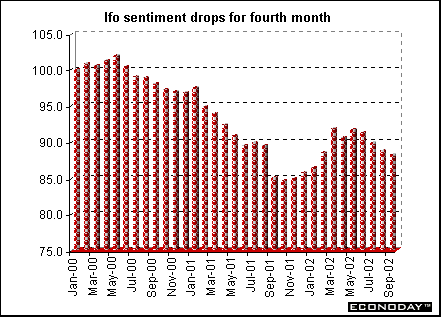
September Ifo Institute west German business sentiment index dropped to 88.2, the lowest level since January. This was the fourth consecutive monthly drop due mainly to weaker confidence in the construction and retail sectors. The fall was due to a drop in the west German future expectations sub-index which fell to 99.3 from 100.7 in August. Expectations were also the lowest since January. However, the west German current business conditions sub-index rose slightly from 77.3 in August to 77.5, the first rise since June. East German business sentiment declined to 98.5 from 99.1 in August, the third consecutive monthly drop and also the lowest level since January. East German sentiment on current conditions slipped to 115.1 from 115.5 while the expectations index fell to 82.7 from 83.6.
August seasonally adjusted producer prices fell 0.1 percent and 1.0 percent when compared with last year. Energy prices fell 0.7 percent and 5.6 percent on the year. Excluding energy prices, the PPI rose 0.1 percent and 0.5 percent on the year.
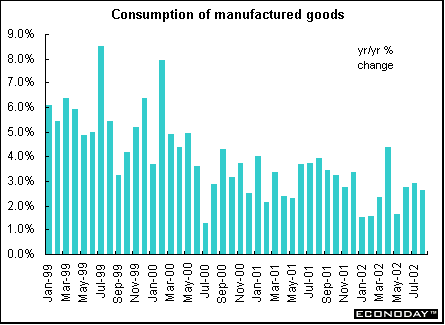
France - July and August seasonally and calendar adjusted consumer spending on manufactured goods rose a combined 1.2 percent compared to June. When compared with last year, July rose by 2.9 percent while August rose by 2.6 percent. Higher clothing and household durable purchases offset a plunge in car sales. Spending excluding autos and parts (as well as medical products) was relatively stable over the summer, rising 1.4 percent in July and 1.3 percent in August.
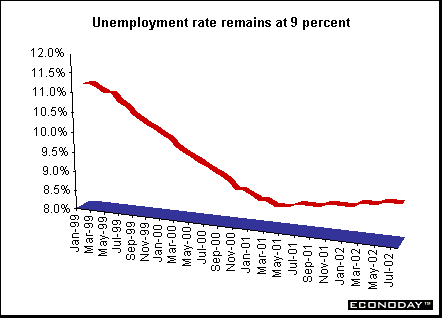
August seasonally adjusted International Labor Organization unemployment dipped by 1,000, the first decline since January. Yet it is still up 110,000, or 4.7 percent, when compared with last year. The unemployment rate remained at 9.0 percent for the third month in a row.
July producer prices rose 0.3 percent while August producer prices edged up by 0.2 percent. The PPI was down 0.2 percent when compared with last year. Energy prices rose 0.8 percent in July and 1.3 percent in August, but were down 1.1 percent on the year in August. Excluding energy and agriculture, the core PPI was up 0.2 percent in July and up 0.1 percent in August, for a gain of 0.3 percent on the year.
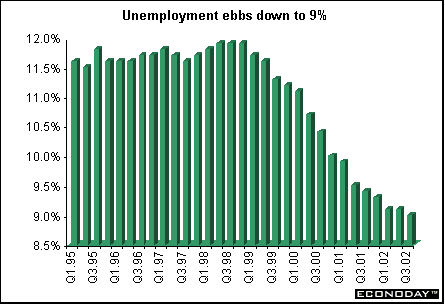
Italy - July seasonally adjusted unemployment rate edged down to 9.0 percent from 9.1 percent in April, to post its lowest level since the index was created in October 1992. In 2001 the average unemployment rate was 9.6 percent, down from 10.6 percent in 2000 and 11.4 percent in 1999. The employment surveys are carried out every three months (January, April, July and October).
July seasonally adjusted industrial orders rose 1.9 percent and jumped 9.4 percent when compared with last year. Domestic orders rose 2.1 percent and 8.5 percent on the year while foreign orders climbed 1.6 percent and soared 10.9 percent on the year. Domestic orders account for roughly 63 percent of the overall index, with foreign orders making up the remainder. Nine of ten product sectors rose on the year.
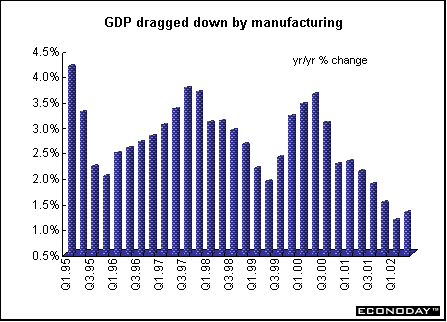
Britain - Second-quarter gross domestic product rose 0.6 percent and 1.3 percent when compared with last year. Household expenditure rose 1.4 percent and 4.1 percent on the year. The gains in household sector spending were partially offset by a decline in government expenditures. Service sector growth climbed 0.6 percent on the quarter, up from just 0.1 percent in the previous quarter. Manufacturing, however, posted its sixth successive quarterly fall, declining 0.7 percent.
Asia
Japan - July seasonally adjusted tertiary activity index, which reflects activity in six industries (utilities, transport and telecommunications, wholesale and retail, finance and insurance, real estate and services), rose 0.3 percent and 0.9 percent when compared with last year. The all-industry activity index, which adds activity in the construction, agricultural and fishery industries, the public sector and industrial output to the tertiary index, rose 0.2 percent. The index is used as a proxy for GDP.
August merchandise trade surplus rose to ¥644.1billion ($5.2billion) - its sixth consecutive monthly increase. Exports rose for a fifth consecutive month in August, but imports fell, reflecting the country's two-track economy - export-driven manufacturing has surged but domestic demand remains weak. Exports rose 6.2 percent when compared with last year, primarily due to robust demand in Asia. Car exports to the U.S. fell for the first time in eight months, down 8.3 percent on the year. Imports fell 2.7 percent on the year.
September seasonally adjusted Tokyo consumer prices slipped 0.2 percent and 0.9 percent when compared with last year. Tokyo core CPI, which excludes fresh food, fell 0.1 percent and dropped 0.9 percent on the year. August nationwide CPI rose 0.3 percent but sank 0.9 percent when compared with last year. Excluding food, the CPI was unchanged on the month but down 0.9 percent on the year.
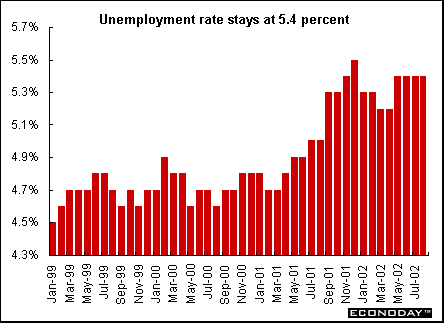
August unemployment rate was unchanged at 5.4 percent for the fourth straight month and just below the record 5.5 percent reached in December. Employment fell by 20,000 jobs while 40,000 people entered the workforce. The number of unemployed rose by 50,000 to 3.65 million. There were 54 jobs for every 100 applicants at job placement centers last month.
August retail sales fell 2.0 percent from a year earlier. Overall sales were down for the 17th straight month, after falling 5.3 percent in July. Sales at large-scale retailers rose 0.1 percent after adjustment for the change in the number of stores, reversing a 5.7 percent fall in July.
After two months of gains, real spending by wage earners fell 2.0 percent in August (or no change when compared with last year).
Americas
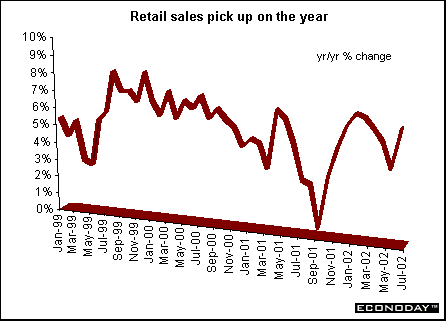
Canada - July retail sales fell 0.3 percent sales following a 1.9 percent gain in June and a 1.0 percent decline in May. Excluding sales by motor and recreational vehicle dealers, retail sales slipped 0.1 percent in July after a 2.2 percent gain in June. However, when compared with last year, retail sales were up 6.5 percent. July's weakness was concentrated in the clothing, furniture and general merchandise sectors. Sales advanced in the food and automotive sectors. In constant dollars, retail sales fell 0.7 percent following a 1.8 percent increase in June.
August industrial product price index rose 0.6 percent and 0.4 percent when compared with last year. This was the first gain in 10 months, primarily the result of year-over-year increases for motor vehicles and other transport equipment as well as for primary metal products. Higher prices of chemicals and chemical products, fruit, vegetable and feed products, and electrical and communication products also contributed to the annual increase in manufacturers' prices. However, lower prices for lumber products, petroleum and coal products, and meat, fish and dairy products partly offset these advances. When petroleum and coal product prices are excluded, the IPPI rose 0.6 percent on the year instead of 0.4 percent.
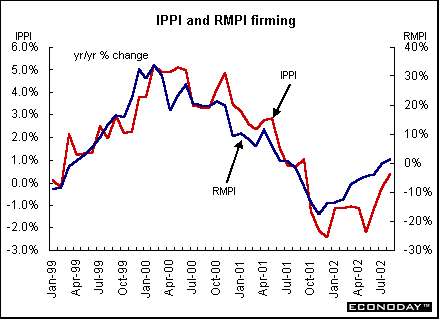
August raw materials price index jumped 1.1 percent and 1.5 percent when compared with last year. On a monthly basis, higher prices for mineral fuels, vegetable products and wood products were the major contributors to the gain. Price decreases for non-ferrous metals and animal products partly offset this monthly increase. In the RMPI, crude oil prices were 4.3 percent higher in August, mainly because of higher demand and anticipation of decreased supply. This rise was also reflected in the IPPI, as petroleum and coal product prices were up 2.5 percent from July.
In August, the value of the U.S. dollar strengthened against the Canadian dollar, pushing up prices of commodities that are quoted in U.S. dollars. As a result, the total IPPI excluding the effect of the exchange rate would have increased 0.2 percent instead of 0.6 percent. On a 12-month basis, the influence of the dollar also had an impact. The IPPI was up 0.4 percent in August from August 2001; without the exchange rate effect, the IPPI would have decreased 0.2 percent.


Last Week's Highlights • Global
Stock Market Indexes • Recap of Global Markets
• Currencies • Indicator
Scoreboard

The Bottom Line •
Looking Ahead
|