
Indicator scoreboard
EMU - August seasonally adjusted Reuters purchasing managers manufacturing survey edged up to 49.1 from 48.0 in July. This means that the pace of contraction has slowed. Any reading below the 50 percent breakeven level denotes contraction. A sharp recovery in France alongside more modest gains in Germany and smaller countries offset an unexpected setback in Italy.
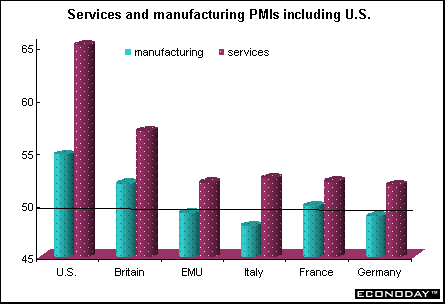
August seasonally adjusted Reuters purchasing managers services survey jumped to 52 from 50.2 in July. This was the second straight month of growth after five months of contraction. The improvement in services sector sentiment is the latest survey data suggesting that the eurozone economy has bottomed out. New business in the services sector expanded for the first time since December. Business expectations also improved further in August, with the index reading rising to 65.9 from 65.5 in July.
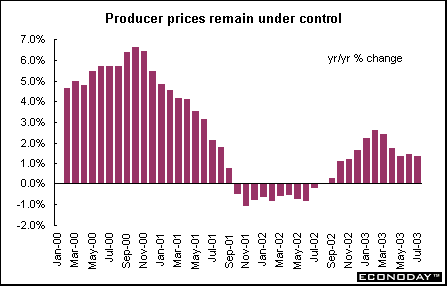
July producer prices were unchanged and up 1.3 percent when compared with last year. A sharp increase in energy prices was offset by a drop in immediate goods prices. Energy prices were up 0.7 percent and 3.6 percent on the year. Excluding energy, the PPI was down 0.1 percent and up 0.6 percent on the year.
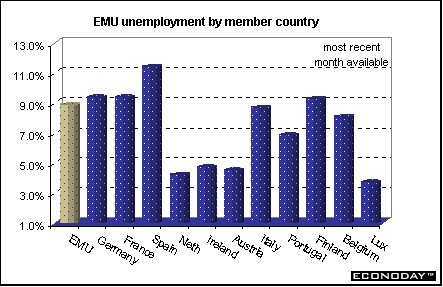
July seasonally adjusted unemployment rate remained at 8.9 percent. Of the eight countries reporting data, unemployment rose in three and was unchanged in five. Spain continued to show the highest unemployment rate while Austria showed the lowest. It was estimated that 12.5 million men and women were unemployed in the eurozone.
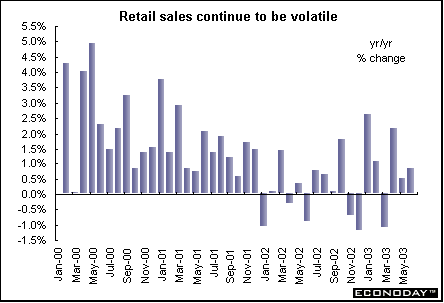
June real workday and seasonally adjusted retail sales were flat but were up 0.7 percent when compared with last year. Sales among categories were mixed. Retail sales were up in Spain, Ireland, Austria, Finland, France and Germany. The largest declines occurred in Portugal, Italy and Belgium. Data were not available for Greece, Luxembourg and the Netherlands.
Germany - July seasonally adjusted manufacturing orders edged down 0.1 percent and 0.6 percent when compared with last year. Domestic orders were up 1.1 percent but foreign orders plunged 1.5 percent. Total capital goods orders were down 2.1 percent after rising 4.6 percent in June. Consumer goods orders increased 2.3 percent, largely offsetting the 2.6 percent drop in June. West German orders fell 0.5 percent after climbing 2.7 percent in the previous month while east German orders jumped 5 percent after a 1.2 percent drop.
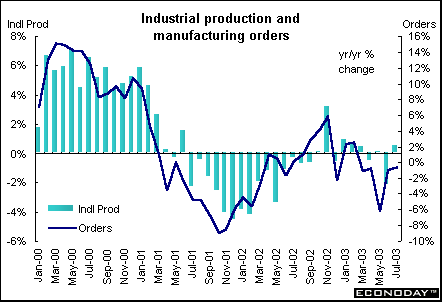
July seasonally adjusted industrial production soared 2.4 percent (the largest increase in three years) and 0.5 percent when compared with last year. Part of the increase in July production came as companies made up for production lost due to a June strike in eastern Germany. Manufacturing production rose 3.3 percent, led by a 7.2 percent jump in goods such as factory machinery.
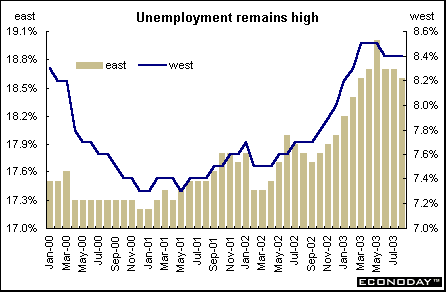
August seasonally adjusted unemployment was unchanged. It was up 5,000 in the west but down 5,000 in the east. The unemployment rate for all of Germany was 10.6 percent, 18.6 percent in the east and 8.4 percent in the west. Payroll jobs have dropped 18 months in a row and are down 286,000 since the start of the year.
Italy - June merchandise trade deficit with the rest of the world was 532 million compared with a surplus of 978 million a year earlier. Imports from the rest of the world were up 2.2 percent while exports sank 4.9 percent on the year. The euro's appreciation was at its peak in June and contributed to the deficit. Merchandise trade deficit with the EU was 1.208 billion, worse than the 473 million recorded in June 2002. Exports to the EU were down 4.2 percent while imports were up 2.2 percent on the year.
Britain - August Chartered Institute of Purchasing and Supply manufacturing index climbed to 51.9 from 51.1 in July. A level above 50 indicates the sector is growing and a figure below 50 shows manufacturing contracting. The pick-up reflected a sharp rise in export and new orders. (See graph in EMU section above)
August Chartered Institute of Purchasing and Supply services index rose to 57, up from 56.6 in July and at its highest level since January 2001. Incoming new business index jumped to 57.5 from 56.0 in July. The employment index rose above the contraction/expansion level to 50.4 from 47.7 in July. (See graph in EMU section above)
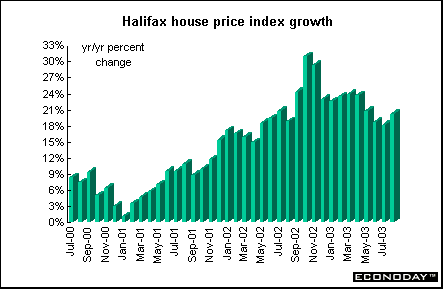
August Halifax house price index rose 1.3 percent and 20.3 percent when compared with last year. For the three months June through August, prices rose 19.1 percent when compared with the same period a year earlier. The Halifax said it still believed the rate of house-price inflation would slow over the remainder of the year.
Asia
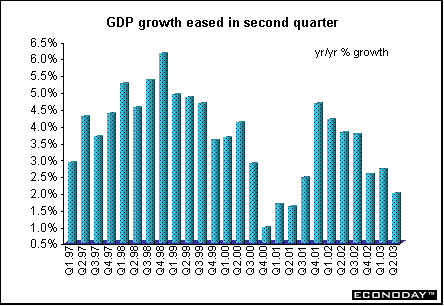
Australia - Second quarter gross domestic product was up 0.1 percent and 2.0 percent when compared with the second quarter of 2002. This was the slowest pace in 2½ years as the worst drought in a century curbed farm exports and as the SARS epidemic in Asia reduced tourist arrivals. As drought gripped 70 percent of the nation, farm production dropped 5.7 percent, the sixth straight quarter of decline. Farm production slumped 32 percent from a year earlier. Exports declined 4.7 percent. Household spending rose 1.2 percent and business investment increased 1.8 percent.
Americas
Canada - July industrial product price index (IPPI) was up 1.3 percent but down 1.6 percent when compared with last year largely due to the effect of the Canadian dollar against the U.S. dollar. If the impact of the Canadian dollar were removed, IPPI would have risen 1.0 percent rather than falling 1.6 percent from the previous year. Higher prices for motor vehicles and other transport equipment, lumber and other wood products, and primary metal products were the major contributors to the increase. However, prices for meat, fish and dairy products were down. Lower prices for beef products were responsible for this decrease, the result of the impact of last May's detection of a single case of bovine spongiform encephalopathy (BSE), or mad cow disease.
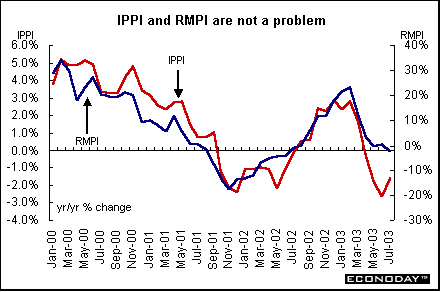
July raw materials price index (RMPI) dropped 1.5 percent and 2.4 percent when compared with last year. Animals and animal products were the major contributors to the monthly decline with prices sinking 10.1 percent thanks to the discovery of a single case of BSE, or mad cow disease, in May. Lower prices for vegetable products as well as wood products also contributed to the decline. Mineral fuels increased slightly by 0.1 percent as crude oil prices remained unchanged from June. Higher prices for non-ferrous metals and ferrous materials partly offset the monthly decrease.
Between June and July, the value of the U.S. dollar strengthened against the Canadian dollar, pushing up prices of commodities that are quoted in U.S. dollars, notably motor vehicles and lumber products. As a result, the total IPPI excluding the effect of the exchange rate would have edged up 0.1 percent instead of increasing 1.3 percent. However, on the year, the Canadian dollar is much stronger. Consequently, the IPPI excluding the effect of the exchange rate would have increased 1.0 percent rather than declining 1.6 percent from July 2002 to July 2003.
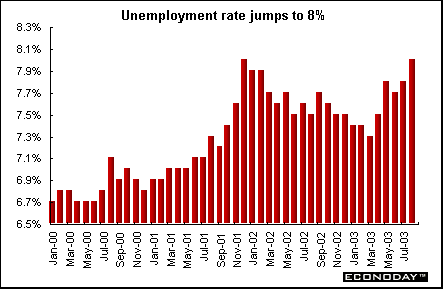
August unemployment rate jumped to 8 percent from 7.8 percent in the previous month. The last time the rate was at 8.0 percent was in December 2001. At the same time, employment fell by 19,000 jobs. While the Ontario-U.S. power outage was unlikely to have affected employment and unemployment, the blackout caused a significant number of people to miss work during the Labour Force Survey reference week (August 10 to 16). From the day of the outage on August 14 through the next two days, an estimated one in four Ontario employees (1.3 million people) missed some work as a direct result of the blackout. This does not include the time lost during the period of power conservation the week following the outage. Nationwide, the largest loss in employment was in the management of companies, administrative and other support services industry, where employment dropped 24,000. A drop in full-time employment was behind the overall employment decline in August. Full-time employment fell 22,000. There was also a drop in full-time work in manufacturing. Manufacturing employment was unchanged in August.
 |

Last Week's Highlights • Global
Stock Market Indexes • Recap of Global Markets
• Currencies • Indicator
Scoreboard
The Bottom Line •
Looking Ahead
|