
Indicator scoreboard
EMU - July M3 money supply growth rose to 8.5 percent from 8.4 percent in June. The three-month moving average for the May-to-July period was up 8.5 percent when compared with the same three months a year ago. The ECB's target rate of money supply growth is 4.5 percent.

August flash harmonized index of consumer prices jumped 2.1 percent from 1.9 percent when compared with last year. In order to compute its HICP flash estimates, Eurostat uses early price information provided by Germany, Italy and - if available - by other members as well as early information about energy prices.

Germany - August Ifo Institute's west German business sentiment index jumped to 90.8 from 89.3 in July led by increases in manufacturing and wholesale trade. Increases in both expectations and current conditions pushed the overall index higher. Expectations rose to 102.1 from 100.2 in July. Current conditions also rose strongly to 79.9 from 78.7.

June total real seasonally adjusted retail sales plummeted 1.8 percent and 1.1 percent when compared with last year. Excluding autos and gasoline station sales, retail sales sank 1.5 percent and 1.8 percent on the year.
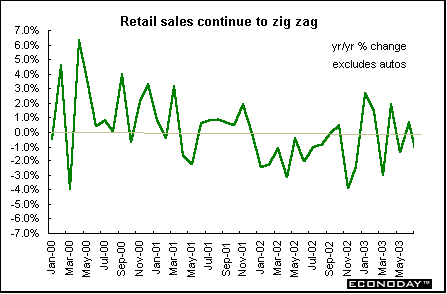
France - July seasonally adjusted unemployment increased by 20,000 and pushed the unemployment rate up to 9.6 percent from 9.5 percent in June. This brought the number of jobless to 2.6 million according to the ILO definition, which excludes jobseekers who did any work during the month.
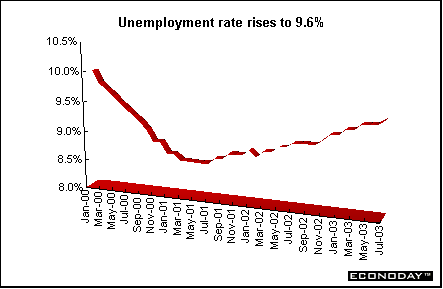
Italy - June retail sales were down 0.4 percent but edged up 0.2 percent on the year. Food sales were up 3.1 percent while non-food sales were down 1.8 percent on the year.
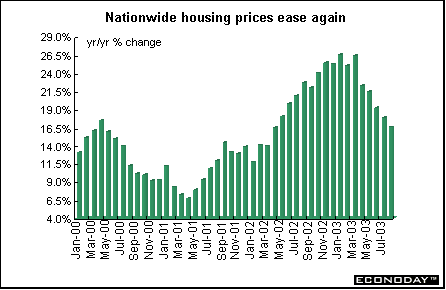
Britain - August Nationwide house price index was up 1.1 percent and 16.6 percent when compared with last year. Activity in the housing market declined sharply in the second quarter compared with a year earlier, with turnover down 23 percent. The Bank of England's Monetary Policy Committee has forecast that house price inflation will slow to zero over its two year forecast horizon, but a raft of recent data have shown house prices continuing to rise in spite of slower turnover reported by the Nationwide.
Asia
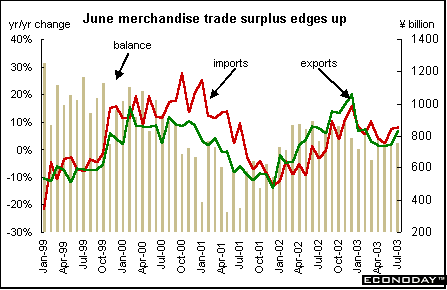
Japan - July seasonally adjusted merchandise trade surplus rose 3.5 percent to ¥753.7 billion yen ($6.4 billion). Exports rose 1.1 percent and imports rose 0.6 percent. The trade surplus rose to ¥799.2 billion when compared with a year earlier as exports recovered enough to slightly outpace import growth. Brisk exports to Asia offset sluggish demand in the United States. Japan's surplus with the U.S. shrank by 6.2 percent in July from the same month a year ago, marking the seventh consecutive month of decline. Exports to the United States were down 7.3 percent, while imports fell 8.4 percent. The drop was mainly due to a slump in shipments of Japanese cars, auto parts, computers and motorcycles. Japan's trade with Asia recovered with the surplus growing 16.7 percent.
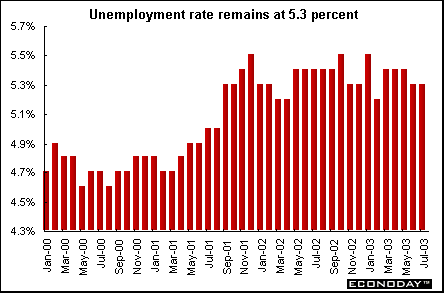
July unemployment rate was unchanged at 5.3 percent showing that labor market conditions remain severe despite signs of improvement in the economy. The jobless rate has remained stubbornly high - at least by Japanese standards - as many companies pay down debt rather than add new workers.
July seasonally adjusted spending by households headed by a salaried worker plunged 6.9 percent and 6 percent when compared with last year. Consumer spending remains on unstable footing despite signs of improvement in other areas of economy. The unseasonably cool weather in July may have taken a toll on spending during the month. Wage earner spending is an important gauge of personal consumption, which accounts for roughly 55 percent of Japan's gross domestic product.
July seasonally adjusted propensity for wage earners to consume, a ratio that measures the amount of disposable income that went to household spending, fell to 73.4 percent from 77.4 percent in June.
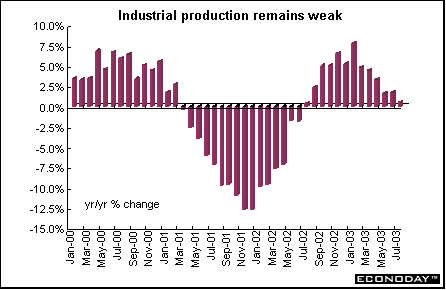
July industrial production rose 0.5 percent when compared with last year. Industrial production was up on rising exports, which have helped steady the economy.
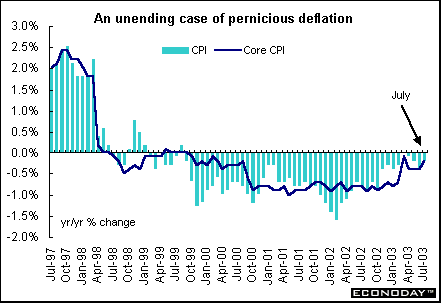
August Tokyo consumer price index was up 0.2 percent but down 0.6 percent when compared with last year. The core CPI, which excludes volatile fresh food prices, was up 0.3 percent but down 0.3 percent on the year. This was the 47th straight month of decline, highlighting deflation's continued grip on the economy. July nationwide consumer price index fell 0.2 percent and 0.2 percent on the year. The core CPI was unchanged in July but fell 0.2 percent from a year earlier. The decline was the 46th in as many months. The Bank of Japan uses nationwide core CPI as its chief price indicator.
Americas
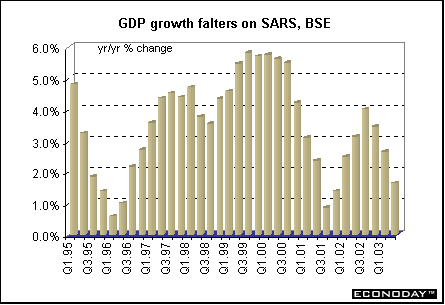
Canada - June gross domestic product at basic prices edged up 0.1 percent and 1.9 percent when compared with last year. The economy's sluggishness can be attributed to a continuing decline in industrial production, with significantly lower output in manufacturing and utilities. Most service sectors fared well with the exception of wholesale trade. Finance and real estate sector output was boosted by an improving stock market and the torrid pace of existing housing sales. Post-secondary educational institutions were busier as a result of increased demand for summer programs. Many tourism-related industries reeling from the impact of SARS improved somewhat in June. Industrial production fell for a fifth consecutive month. A burst of oil and gas exploration mitigated the slide, as output in manufacturing and utilities fell significantly. Manufacturing output fell 1.1 percent, the largest monthly decline since September 2001. The decline in manufacturing output was fairly widespread. Effects of the mad cow crisis continued to push down production of meat products and slaughtering. The output of Canadian sawmills fell 6.2 percent as the impact of a higher Canadian dollar coupled with punitive tariffs thwarted export sales to the United States.
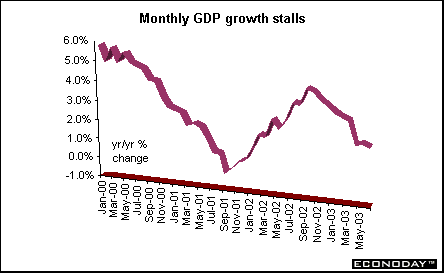
Second quarter gross domestic product slipped 0.1 percent but was up 1.6 percent when compared with the second quarter of last year. This is the first quarterly contraction in economic activity since the third quarter of 2001. Much of the weakness came in April at the height of the SARS outbreak. A slowdown of business investment in inventories held the economy back in the second quarter. The deceleration was centered entirely in the wholesale and retail trade industries. Consumer spending and business investment both shored up the economy, but with less impact than in the first, as both slowed significantly from their first-quarter pace. With SARS and the war in Iraq, the number of Canadians traveling abroad and of non-residents traveling to Canada both dropped sharply.


Last Week's Highlights • Global
Stock Market Indexes • Recap of Global Markets
• Currencies • Indicator
Scoreboard

The Bottom Line •
Looking Ahead
|