
Indicator scoreboard
EMU - May seasonally adjusted unemployment rate
was unchanged at 8.8 percent. The unemployment rate was 8.3 percent in May
2002. Of the nine countries reporting data, unemployment rose in two, fell in
one, and was unchanged in six. Spain continued to show the highest unemployment
rate while Luxembourg showed the lowest.

June Reuters seasonally adjusted purchasing managers’ manufacturing index
contracted to 46.4 from 46.8 reported in May. This is the lowest level since January
2002. An index level below 50 signals contraction while above 50, expansion.
The lower the index is below 50, the faster the sector’s decline. The rise in
the euro continued to undermine new orders, which fell for the fourth straight
month and at the fastest pace in two and half years.

June Reuters seasonally adjusted services business activity index
contracted for the fifth straight month. It posted a 48.2 percent level. A
reading of 50 is the breakeven point that signals expansion or contraction. The
data confirmed the absence of inflation risks, as input prices were practically
flat at a record low thanks to cheap oil and the stronger euro while prices
charged fell for the 11th straight month. Germany remained the weakest country,
while France contracted for the first time in 19 months.

April real seasonally adjusted retail sales rose 1.5 percent and
2.1 percent when compared with last year. Sales were boosted by the late
Easter. Sales were up for all categories. Sales increased in all countries with
the exception of Portugal and Belgium.

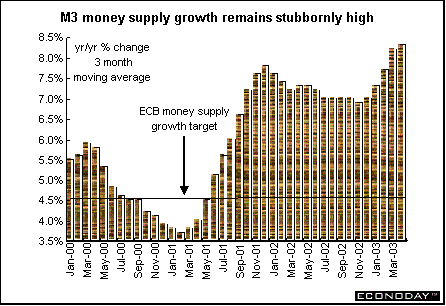
May seasonally adjusted M3 money supply increased 0.5
percent and 8.5 percent when compared with last year. The three-month moving
average for the March-through-May period inched up to 8.3 percent when compared
with the same three months a year ago. The moving average, which is the ECB’s
preferred M3 measure, remains above the Bank’s 4.5 percent reference rate.
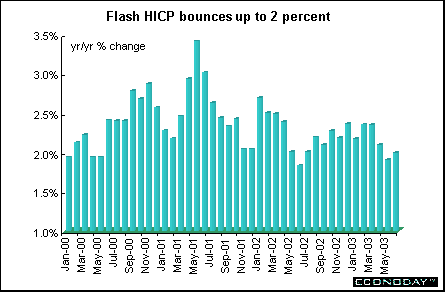
June flash harmonized index of consumer prices was up 2.0
percent when compared with last year. The increase brings the HICP back above
the ECB's price stability definition of close to but below 2 percent. In May,
HICP had dipped below 2 percent for the first time since February 2001. In
order to compute its HICP flash estimates, Eurostat uses early price
information provided by Germany, Italy and by other member states if available
as well as early information about energy prices.
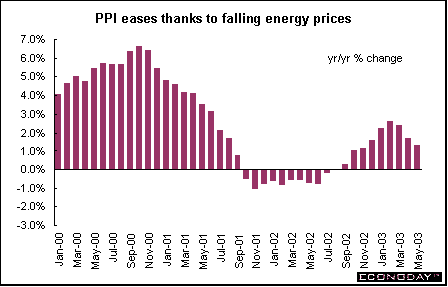
May producer price index declined 0.4 percent but
increased 1.3 percent when compared with last year. May energy prices sank 1.8
percent, but still climbed 1.7 percent on the year. Excluding energy, the PPI
was unchanged and up 1.0 percent on the year.
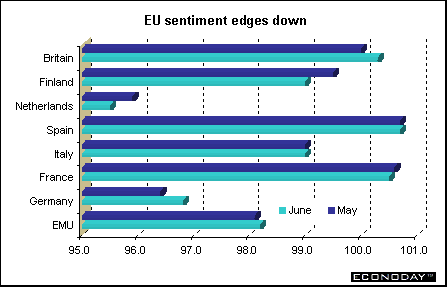
June EU Commission economic sentiment index inched up
to 98.2 from 98.1 in May. Increases in both industrial and consumer confidence
more than offset a drop in retail confidence and unchanged construction
sentiment. Industry confidence edged up to minus 12 from minus 13 while
consumer confidence improved to minus 19 from minus 20 in the previous month.
Construction sentiment was unchanged while retail confidence slipped to minus
14 from minus 13 in May. Services sector confidence, which is not part of the
headline index, was up to minus 1 from minus 2 in May.
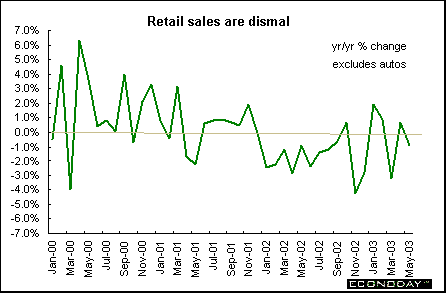
Germany - May
seasonally adjusted retail sales (including sales at auto
dealerships) dropped 0.6 percent and 0.9 percent when compared with last year.
Excluding autos and petrol sales, retail sales rose 0.1 percent and were down
1.5 percent on the year.
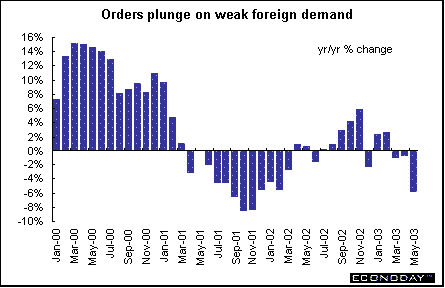
May seasonally
adjusted manufacturing
orders plunged 2.2 percent and 5.8 percent when compared with last
year. The higher euro and weak world growth took the starch out of foreign
orders. Foreign orders sank 4.8 percent while domestic orders edged up 0.2
percent. West German orders fell 2.0 percent while in east Germany orders
plummeted 3.4 percent.
Italy - May producer
price index dropped 0.3 percent but was up 1.6 percent when compared
with last year. May’s decline was largely the result of lower international oil
prices, which pushed down energy costs for the second month. Excluding energy,
the PPI was unchanged and up 1.1 percent on the year.
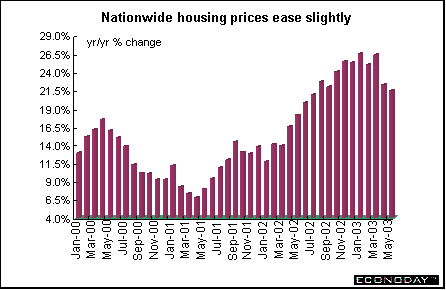
Britain - June seasonally adjusted Nationwide house
price index rose 0.9 percent and 19.2 percent on the year.
Nationwide said that a weaker labor market would provide a check on house price
growth particularly where affordability is stretched. However, the next
movement in interest rates is still likely to be down, and any rise in
unemployment looks modest by historical standards.
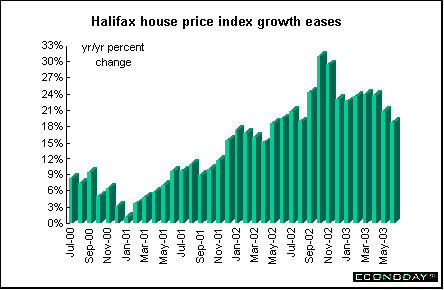
June Halifax house price index rose 0.6 percent and
18.8 percent when compared with last year. For the April-through-June
three-month period, prices were up 21.9 percent compared with the same period a
year ago. Halifax expects the rate of house price growth to ease even though
prices grew faster than expected in the first half of the year.
Asia
Japan - Second quarter Tankan business
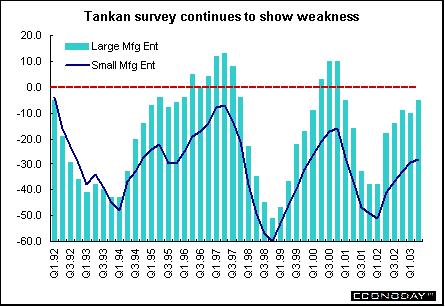
conditions index for large manufacturers rose to minus 5 from minus
10 in the previous survey. The Tankan's sentiment indexes measure the
percentage of companies saying business conditions are better minus the
percentage saying things are worse. The headline index has been negative since
March 2001, with June's negative reading meaning pessimists still outnumbered
optimists. The improvement in sentiment was less pronounced among small
manufacturers and non-manufacturers, who mostly do business in Japan rather
than abroad. The sentiment index for non-manufacturers inched up to minus 13
from March's minus 14. Small manufacturers’ sentiment dipped to minus 28 from
minus 29 in the first quarter. The Tankan — which means short-term outlook —
surveys executives at 8,343 companies on their views of the economy, sales,
profits, spending, employment and other business plans. The survey was
conducted between May 30 and June 30.
 |


Last Week's Highlights • Global
Stock Market Indexes • Recap of Global Markets
• Currencies • Indicator
Scoreboard

The Bottom Line •
Looking Ahead
|