
Indicator
scoreboard
Germany
- April seasonally adjusted industrial
production was revised to a decline of 1.2 percent from
the originally reported drop of 1.0 percent. Industrial production
excluding construction - the figure that Eurostat uses when publishing
eurozone industrial output - was revised to a 1.4 percent drop from
the initially reported decline of 1.1 percent. Manufacturing output
was revised to a decline of 1.3 percent from the original 1.1 percent
drop.

June
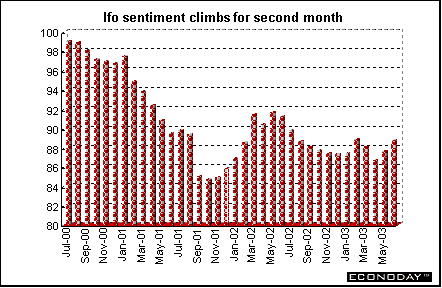
Ifo Institute west German business sentiment
rose to 88.8 from 87.6 in May. Both current conditions and expectations
improved. Expectations rose to their highest level since September
2002, reaching 98.6 from 97.2 in May. Current conditions rose to
79.4 from 78.3, the first increase since January. Sentiment in all
four industry sectors (retail, manufacturing, wholesale and construction)
improved. East German business sentiment rose to 102.0 from May's
at 100.9. Expectations rose to 84.9 from 81.6, current conditions
fell back to 120.3.
France
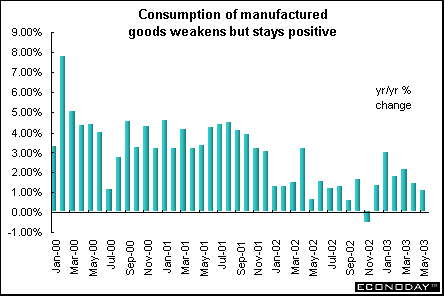
- May seasonally and calendar adjusted consumer
spending on manufactured goods dropped 1.6 percent, with
declines in all categories led by clothing and autos. Sales were
up 1.0 percent when compared with last year. Clothing and textiles
sales plunged 4.1 percent after a 2.1 percent drop in April. Auto
sales were down 3.7 percent and 7.5 percent lower on the year. Excluding
autos, auto parts and drugs, spending was down 1.2 percent but still
2.7 percent higher on the year.
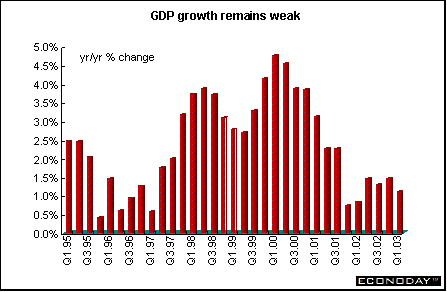
First quarter
seasonally and workday adjusted gross domestic
product climbed 0.3 percent and 1.1 percent when compared
with last year. Consumption rose by 0.5 percent while investment
inched up 0.2 percent.
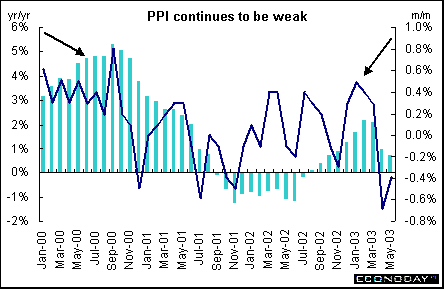
May
producer prices
declined 0.4 percent but were up 0.7 percent when compared with
last year. The drop was due to sinking energy prices, which were
down 2.2 percent on the month. Excluding food and energy, the PPI
was flat and up 0.6 percent on the year.
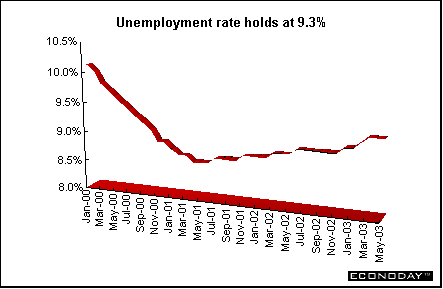
May seasonally
adjusted unemployment rose by
9,000 but the unemployment rate
remained at 9.3 percent. The data are calculated using the International
Labour Organization which excludes jobseekers who did any work during
the month. Last month's postal strikes may have delayed the arrival
of jobseekers' declarations, giving a downward bias to the results,
the Ministry cautioned.
Italy
- April retail sales jumped
5.7 percent when compared with last year. The increase was due to
soaring food sales mainly due to seasonal factors. Seasonally adjusted
April retail sales were up 0.9 percent.
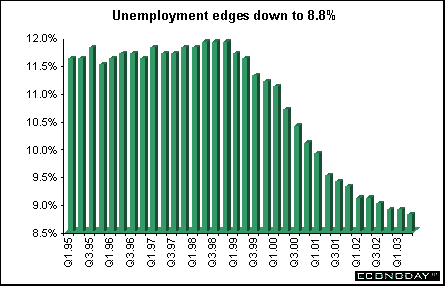
April seasonally
adjusted unemployment rate declined
to 8.8 percent from a revised 8.9 percent in January. This is the
series' lowest level since it was created in October 1992. The unemployment
drop occurred because of a decline in those looking for work rather
than an increase in the number of jobs. ISTAT employment surveys
are carried out every three months (January, April, July and October).
Britain
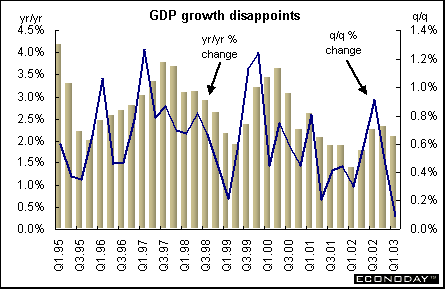
- First quarter gross domestic product
was revised downward. GDP managed to inch up 0.1 percent and 2.1
percent when compared with last year. The reason for the downward
revision was a sharp change in construction output from a gain of
2.1 percent to a drop of 1.9 percent. There were also downward revisions
to household spending and gross fixed capital formation.
Belgium
- June Belgian National Bank business sentiment index plunged to
minus 21.5, the lowest level since August 1993. The decline primarily
reflected the erosion in manufacturing sentiment, which fell to
a 10-year low of minus 26.5. Belgian industry morale is widely seen
as a good indicator of eurozone growth six months ahead, given its
large semi-finished goods sector and its dependence on European
demand.
Asia
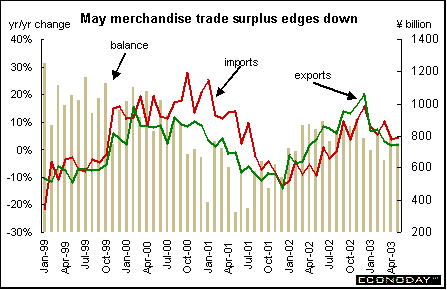
Japan - May seasonally
adjusted merchandise trade surplus
narrowed to ¥758.2 billion ($6.4 billion). Imports rose 2.5
percent, the biggest gain in six months, and exports increased 1
percent. The closure of several nuclear reactors resulted in a surge
of oil imports, which jumped 10.1 percent from a year earlier. Exports
of communications and video equipment rose. The growth in the volume
of exports, which doesn't take into account currency fluctuations,
has slowed every month since November when it rose 18.2 percent
from a year earlier. It rose 2.5 percent in May. Export volumes
to Asia rose 4.4 percent, the smallest gain since March 2002.
May seasonally
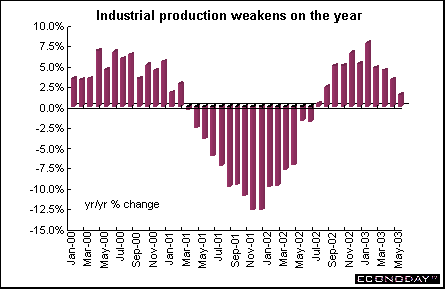
adjusted industrial production
rose 2.5 percent and was up 1.6 percent when compared with last
year. The gains in May were helped by extra working days because
of a shortened Golden Week holiday, and because companies moved
their China production home to prevent supply disruptions amid the
SARS outbreak on the mainland.
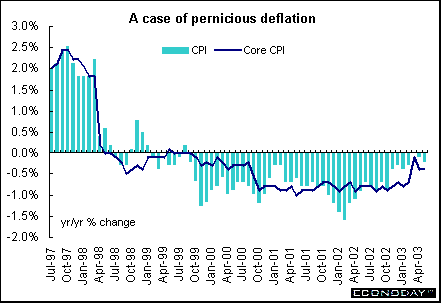
June Tokyo consumer
price index and core CPI, which exclude volatile fresh
food prices, both fell 0.4 percent when compared with last year.
May nationwide CPI fell 0.2
percent and the core CPI sank 0.4 percent on the year. Since March
2001, the Bank of Japan has used nationwide core CPI as its main
price indicator.
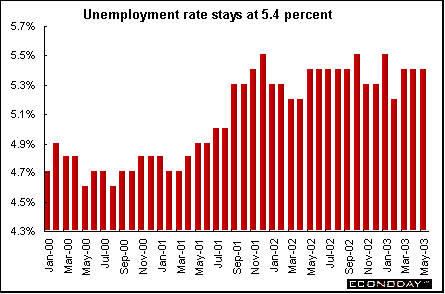
May seasonally
adjusted unemployment rate was
unchanged at 5.4 percent. Companies in the manufacturing, retail
and wholesale industries cut jobs, while the medical and welfare
industries added jobs.
May real seasonally
adjusted spending by Japanese wage earners
fell 2.2 percent and 1.8 percent when compared with last year. Wage
earner spending is an important gauge of personal consumption, which
accounts for roughly 55 percent of Japan's gross domestic product.
The propensity to consume index, which measures the proportion of
disposable income that households spend in the month, fell to a
seasonally adjusted 69.2 percent from 73.1 percent in April.
Americas
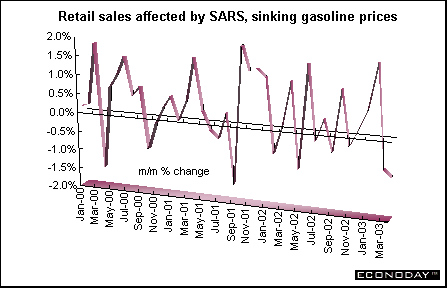
Canada - April retail
sales fell by 0.9 percent but rose 2.2 percent when compared
with last year. All sectors declined with the exception of food.
Two factors conspired to depress sales - sinking gasoline prices
and the outbreak of SARS in the greater Toronto area. Excluding
auto sales, retail sales sank 1.2 percent but were 3.2 percent higher
on the year. In constant dollars, retail sales declined 0.3 percent
in April, after falling 0.8 percent in March.
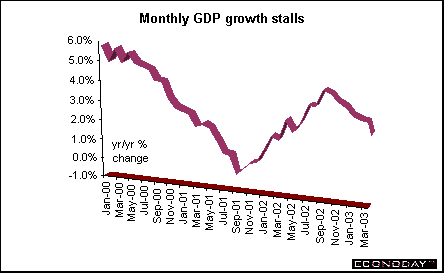
May monthly
gross domestic product fell 0.2 percent after remaining
unchanged in March. This was the economy's first contraction since
September 11, 2001. Most sectors declined. On the year, monthly
GDP rose 1.95 percent. Consumer spending was stalled and industrial
production (manufacturing, mining and utilities) fell for the third
consecutive month. Manufacturing weakness was widespread. International
travel in and out of Canada declined 5.8 percent in April and same-day
trips to Canada from the United States declined 5.6 percent. Some
of this was due to the long declining trend since September 11,
2001, some due to SARS in the Toronto area, and some because of
the U.S. economy.
May industrial
product price index declined 2.0 percent and 1.7 percent
when compared with last year. The decline was in large part because
of the stronger Canadian dollar relative to the U.S. dollar. On
the month, lower prices for motor vehicles and other transport equipment
and petroleum and coal products were the major contributors to the
decline of the IPPI. The petroleum and coal groups continued to
be an influence on the year-over-year change with an increase of
7.1 percent. If petroleum and coal product prices had been excluded,
the IPPI would have declined 2.3 percent instead of decreasing 1.7
percent on a year-over-year basis.
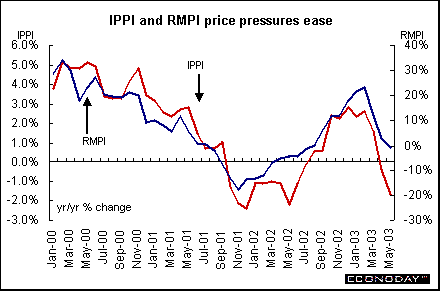
May raw
materials price index dropped 2.5 percent and 0.5 percent
when compared with last year. Mineral fuels were the major contributors
to the monthly decrease with prices declining 3.8 percent. Crude
oil prices were 4.9 percent lower in May than in April. Prices for
wood products, vegetable products and ferrous materials were also
lower.
In May, the
value of the U.S. dollar continued to weaken against the Canadian
dollar, pushing down prices of commodities that are quoted in U.S.
dollars, notably motor vehicles and lumber products. As a result,
the total IPPI excluding the effect of the exchange rate would have
decreased 0.5 percent instead of 2.0 percent. On a 12-month basis,
the influence of the dollar is much stronger. Consequently, the
IPPI excluding the effect of the exchange rate would have increased
1.6 percent rather than declining 1.7 percent in May from May 2002.


Last Week's Highlights • Global
Stock Market Indexes • Recap of Global Markets
• Currencies • Indicator
Scoreboard

The Bottom Line •
Looking Ahead
|