
Indicator scoreboard
EMU - First quarter flash gross domestic product was unchanged and up 0.8 percent when compared with last year. This was the first time that an early flash estimate of GDP was available for EMU. Eurostat gave no component details.

April harmonized index of consumer prices inched up 0.1 percent and increased 2.1 percent when compared with last year. The core HICP (which excludes energy, food, alcohol and tobacco) rose 0.4 percent and 2.0 percent on the year. Energy prices sank 2.9 percent but the decline was offset by increases in clothing, alcohol and tobacco and hotels and restaurant prices.

Germany - May ZEW economic expectations index increased to 18.8. This is the fifth straight month of gains for the index, which is at its highest level since October 2002. The current conditions index also rose, to minus 95.1. The atmosphere reflects the better conditions in financial markets - German stock prices are up 34 percent since the middle of March. The ZEW surveyed 305 German financial experts from April 28 to May 12 for their opinions on current economic conditions and the economic outlook for major industrial economies.
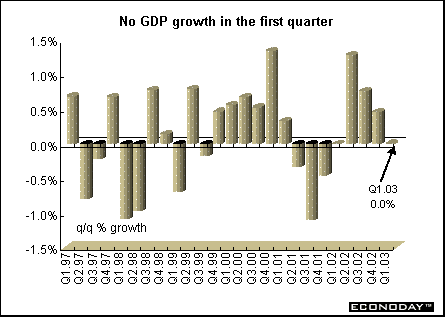
First quarter flash gross domestic product slipped 0.2 percent but managed to edge up 0.2 percent when compared with last year. This was the first flash estimate of GDP and therefore contains few details.

France - March seasonally adjusted industrial output slipped 0.4 percent but climbed 0.5 percent when compared with last year. Manufacturing output jumped 0.6 percent for both the monthly and yearly change. Semi-finished goods and autos both were up 0.9 percent while capital goods managed to eke out a 0.3 percent gain. Consumer goods oozed down 0.1 percent after vaulting 1.9 percent in the prior month.
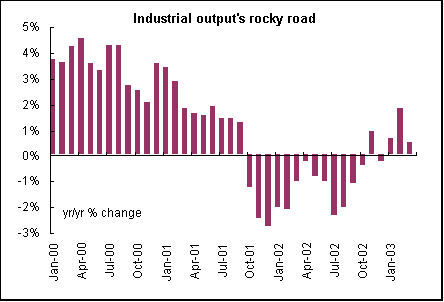
March merchandise trade surplus narrowed to €97 million. Exports sank 2.1 percent while imports slipped by 0.3 percent. The export decline was largest to the other EU countries.
Italy - March seasonally and workday adjusted industrial production dropped 0.4 percent and was down 1.6 percent when compared with last year. Consumer goods' output edged up 0.1 percent while investment goods' output dropped 1.4 percent. Intermediate goods climbed 0.6 percent and energy goods sank 3.9 percent.
First quarter preliminary real gross domestic product slipped 0.1 percent but increased 0.8 percent when compared with last year. Italy is unusual among large eurozone countries in that its GDP data are seasonally but not workday adjusted. However, ISTAT has announced it will publish workday adjusted data starting from the final first quarter GDP release, expected on June 10th. No data on the components were available with this release.
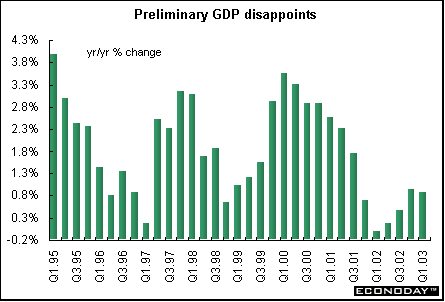
March world merchandise trade deficit was €387 million compared with a surplus of €1.327 billion in March 2002. Exports were flat on the year while imports jumped 8.1 percent. The trade deficit with other EU countries jumped to €626 million compared with a deficit of €182 million a year ago. EU exports rose 1.3 percent while imports increased a more substantial 5.0 percent.
Britain - April seasonally adjusted producer input prices fell 2.8 percent and were up 0.1 percent when compared with last year. An 18 percent plunge in crude oil prices was the reason for the decline. Crude prices are down 7.3 percent on the year. Producer output prices fell 0.1 percent and were up 1.7 percent on the year. The declines in both indexes reflected the effect of the end of the war with Iraq, with gasoline prices down 3 percent on the month. Core output prices, which exclude food, beverages and tobacco, were flat on the month and up 1.3 percent on the year.
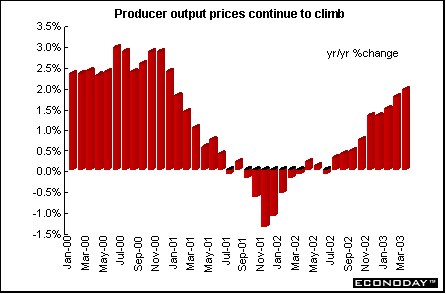
March global merchandise trade gap widened to Stg3.565 billion from Stg3.493 billion in February. The value of exports increased 0.5 percent but this was more than offset by a 0.8 percent climb in the value of imports. The main factor behind the deterioration was an increase in the value of imports from non-EU countries, which caused the non-EU trade gap to widen to Stg2.672 billion from Stg2.434 billion. Non-EU imports were up 2.9 percent on the month, while exports were up just 0.1 percent. Excluding oil and erratics, the global goods trade gap narrowed to Stg3.754 billion from Stg3.964 billion in February. In volume terms EU exports fell 1.1 percent on the month, while imports were up 2.9 percent.
April claimant count unemployment fell 2,100 and the unemployment rate remained at 3.1 percent for the 16th month in a row. The ILO unemployment rate in the three months through March was 5.1 percent, unchanged from the previous three-month period. The ILO definition excludes jobseekers who did any work during the month.
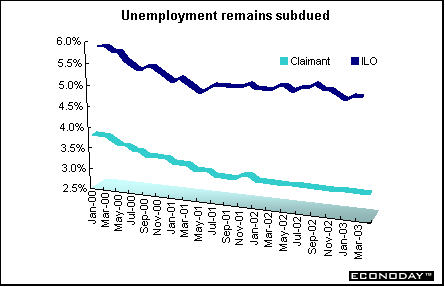
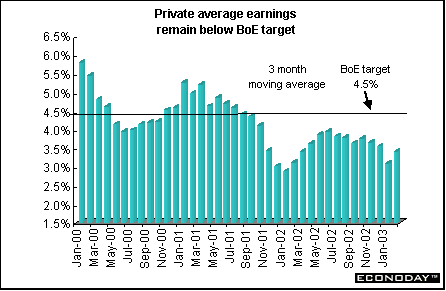
March average earnings growth was up 3.4 percent in March from 3.1 percent in February. Excluding bonuses, earnings were up 3.8 percent on the year, unchanged from February.
Asia
Japan - April corporate bankruptcies and bankruptcy debt both fell from year earlier levels according to Teikoku Databank Ltd. Bankruptcies dropped 7.7 percent to 1,514 cases, the fourth straight month of decline, while debts left behind by insolvent companies fell 29.3 percent to ¥903.06 billion. On the month, debts fell 23.6 percent, while bankruptcy cases fell 3.4 percent.
First quarter gross domestic product was unchanged but up 2.5 percent when compared with last year. GDP was hurt by declining exports - they had been the economy's main prop in prior quarters. Business spending slowed to 1.9 percent from 3.0 percent in the previous quarter while personal consumption improved slightly to 0.3 percent. The GDP deflator sank 3.5 percent on the year. For the fiscal year ending March 31, 2003, GDP was up 1.6 percent over the previous year. On a nominal basis GDP was down 0.6 percent, showing that deflation kept a firm grip on the economy.
Americas
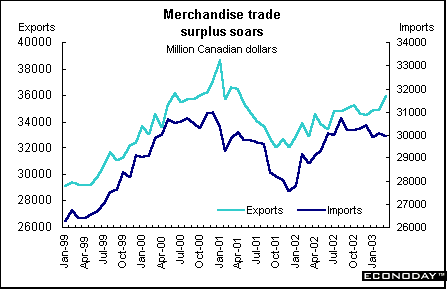
Canada - March merchandise trade surplus soared to C$5.9 billion after dropping in three of the previous four months. Near-record energy exports provided the bulk of the increase in total exports. Excluding energy, exports would have risen by less than 1 percent and the trade balance would have risen by less than a quarter billion dollars. Exports to the United States, which accounted for 84 percent of the total, rose 2.6 percent. Exports to other OECD countries jumped 36.2 percent, while exports to Japan fell 9.4 percent to C$831 million. Imports from the United States fell 2.5 percent, accounting for most of the drop. Increases in imports from Japan and the European Union partly offset these declines. The energy-driven trade surplus with the United States increased by C$1.3 billion - the largest single-month increase in 11 months. Canada's trade deficit with countries other than the United States increased to C$3.5 billion in March from C$3.3 billion in February. Crude petroleum exports increased 12.6 percent, a record level, as a result of stronger volumes, as prices eased to just below record levels. Petroleum and coal products exports pushed to their third straight record high, C$1.1 billion.
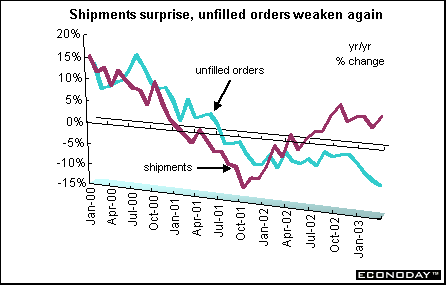
March factory shipments increased 1.4 percent and 6.9 percent when compared with last year. Shipments rose to C$44.7 billion, the highest level since November 2000. Of the 21 manufacturing industries representing 65 percent of total shipments, 13 reported increases. Both non-durable and durable goods sectors were up. Soaring petroleum shipments contributed to a 1.6 percent rise among non-durable goods manufacturers, the fourth increase in a row. Motor vehicle manufacturing boosted shipments of durable goods by 1.2 percent. Unfilled orders declined for the seventh consecutive time, decreasing by 0.4 percent, the lowest level since January 1999. Ongoing weakness in the global aviation sector was partly responsible for the decline. Excluding the aerospace products and parts industry, unfilled orders improved by 0.7 percent. New orders rose to their highest level since August 2002, up 1.6 percent. Motor vehicles, computers and plastic and rubber products industries were the top contributors.
 |


Last Week's Highlights • Global
Stock Market Indexes • Recap of Global Markets
• Currencies • Indicator
Scoreboard

The Bottom Line •
Looking Ahead
|