
Indicator scoreboard
EMU - February seasonally adjusted industrial output edged up 0.2 percent and 1.8 percent when compared with last year. Output increased in energy, capital goods and nondurable consumer goods. Durable consumer goods and intermediate goods output both declined. Output in Ireland, Netherlands, Greece and Portugal was up while output sank in Belgium, Germany and Italy.

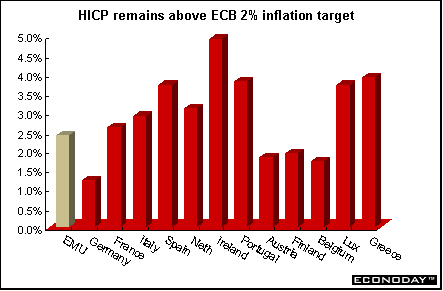
March harmonized index of consumer prices (HICP) was up 0.6 percent and 2.4 percent when compared with last year. The change from last year is above the ECB's 2.0 percent price stability limit. Core HICP excluding energy, food, alcohol, and tobacco increased 0.6 percent and 1.8 percent on the year. Core inflation excluding energy and unprocessed foods - the core inflation measure favored by the ECB - rose 2.0 percent on the year. Prices increased in all categories with the exception of recreation and culture.
Germany - April Zew economic expectations index, which measures sentiment among German financial experts on the economic outlook, increased for the fourth month in a row to 18.4. The increase was largely in reaction to news of the fall of the Iraqi regime. The current conditions index also rose slightly. There was a disparity between responses received before and after April 9th, the day that Baghdad was captured (negative before and positive after). The ZEW survey results on German business sentiment have often correlated well with the corresponding component indices of the closely watched Ifo business sentiment index for west Germany.
France - February seasonally adjusted industrial output climbed 0.6 percent and was up 2.0 percent on the year. Manufacturing output rose 0.3 percent and was up 0.5 percent when compared with last year. Gains for energy, consumer and semi-finished goods offset a downturn in autos. Construction jumped 2.6 percent after a sharp 3.2 percent drop in the prior month.
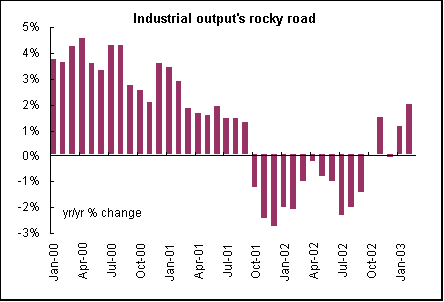
Italy - February seasonally and workday adjusted industrial production slipped 0.3 percent and dropped 1.2 percent when compared with last year. Consumer, investment and intermediate goods were down in February but energy goods jumped.
February world merchandise trade deficit was €423 million compared with a surplus of €257 million a year earlier. Imports from the rest of the world rose 3.1 percent while exports abroad edged down 0.2 percent. With this release, ISTAT modified its survey involving product classifications in order to come into line with EU requirements. Among these changes, energy goods, which were previously incorporated as part of intermediate goods, are now expressed as a separate category.
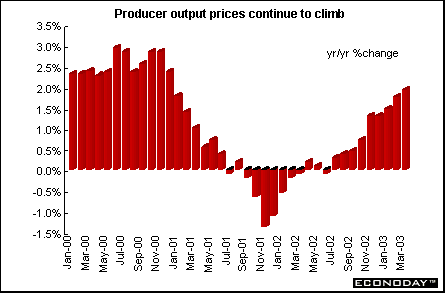
Britain - March producer output prices jumped 0.5 percent and were up 1.9 percent when compared with last year. The main upward influences came from petroleum products, other manufactured goods and food prices. Core output prices, which exclude food, beverages, tobacco and gasoline, inched up 0.1 percent and 1.4 percent on the year. Input prices were unchanged on the month and up 4.5 percent on the year.
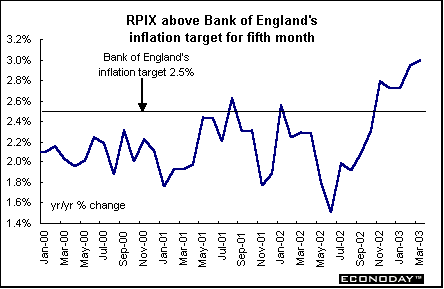
March retail price index was up 0.3 percent and 3.1 percent when compared with last year. The retail price index excluding mortgage interest payments (RPIX) climbed 0.4 percent and 3.0 percent on the year. It was the fifth successive month in which the RPIX was above the 2.5 percent Bank of England inflation target. Not surprisingly, the largest upward effect came from higher gasoline prices. Food, household goods and fares and other travel costs also climbed. Inflation in the service sector remained stable at 4.5 percent.
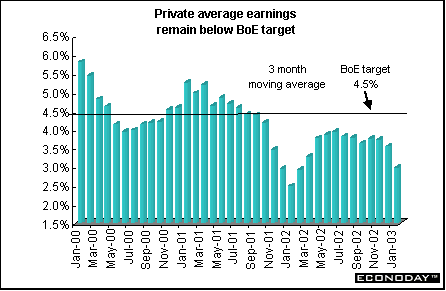
Average earnings for the three-month period from December through February increased 3.0 percent when compared with the same three months a year earlier. Private-sector earnings increased 2.5 percent. Public-sector earnings growth rose to 5.1 percent. Lower bonus payments compared with last year helped to push earnings growth down.
Unemployment for the three months through February declined by 22,000 jobs when compared with the previous 3 months ending in January. The unemployment rate edged up to 5.1 percent from 5.0 percent in the previous month, according to the International Labor Organization definition of unemployment.
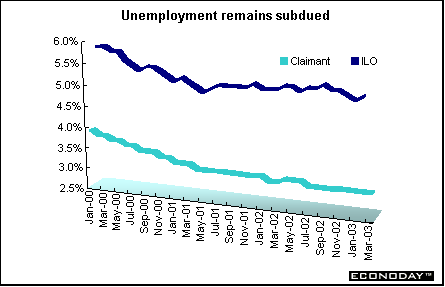
March claimant count measure of unemployment, which measures those who are unemployed and claiming benefits, climbed for a second month - up 1,800. This was the first back-to-back monthly rise since December 2001. The claimant count unemployment rate remained at 3.1 percent.
Americas
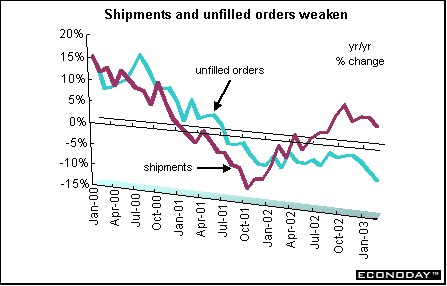
Canada - February manufacturers' shipments declined 0.9 percent but were up 4.7 percent on the year. Motor vehicle manufacturers pulled back moderately contributing to the overall decline in shipments. February's decrease would have been larger but was offset by soaring petroleum and coal product prices. Excluding the motor vehicle and parts industries and the price-inflated shipments of the petroleum and coal products industries, shipments sank 1.3 percent. Overall, 16 of 21 industries, representing 68 percent of total shipments, posted decreases. Unfilled orders declined for the sixth straight month - sinking 0.9 percent. Continuing weakness in the aerospace products and parts industry largely contributed to February's drop. Excluding the aerospace products and parts, unfilled orders rose 0.3 percent. New orders increased for the second month in a row, rising 1.6 percent.
 |


Last Week's Highlights • Global
Stock Market Indexes • Recap of Global Markets
• Currencies • Indicator
Scoreboard

The Bottom Line •
Looking Ahead
|