
Indicator scoreboard
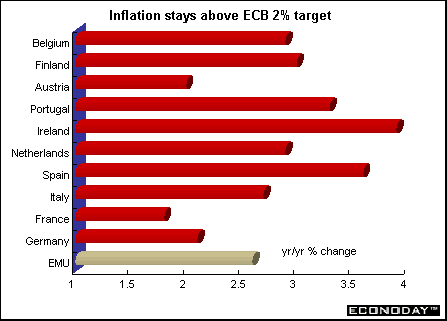
EMU - February harmonized index of consumer prices jumped 0.6 percent and 2.6 percent when compared with last year. The HICP remains above the European Central Bank's two percent inflation target. However, the HICP excluding energy rose 0.4 percent on the month and 2 percent on the year. HICP excluding both food and energy rose 0.4 percent and 1.7 percent when compared with last year. HICP excluding just energy rose 0.4 percent on the month and at an annual rate of 2 percent. Energy prices jumped 1.4 percent. Food prices were up 0.5 percent, likely boosted by the BSE and foot and mouth crises.
Germany - January seasonally adjusted merchandise trade surplus stood at E6.6 billion, up from E2.5 billion in December and up from E4.7 billion in January 2000. The unadjusted trade surplus rose to DM8.7 billion (E4.4 billion) from DM5.8 billion (E2.9 billion) in January 2000. Seasonally adjusted exports were up 5.0 percent and up 19.8 percent on the year. Imports were down 3.0 percent but up 17.4 percent on the year.
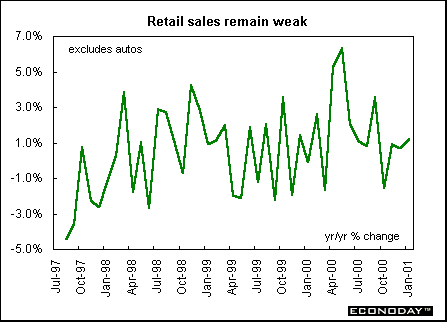
Bundesbank January real seasonally adjusted retail sales were down 0.3 percent but up 1.4 percent when compared with last year. Bundesbank real seasonally adjusted retail sales excluding autos and gasoline stations were down 0.3 percent on the month but up 1.2 percent when compared with last year. But Federal Statistics Office data for retail sales excluding autos and gasoline stations were up 2.5 percent and 4.8 percent when compared with last year. The difference is explained by the fact that Bundesbank data are calendar adjusted while the Statistics Office data are not. There was one more shopping day in January 2001 (26) than in January 2000 (25). The two agencies also use different seasonal adjustment methods.
February wholesale price index jumped 0.9 percent and 3.7 percent when compared with last year. The WPI excluding oil products rose 0.3 percent and 2.6 percent. Wholesale manufactured goods prices excluding oil product prices were flat, with the annual rate declining to 2.7 percent from 3.1 percent in January. The increase in overall WPI was mainly due to petroleum product prices, which rose 5.0 percent. But food prices, particularly meats, also rose sharply due in large part to the BSE crisis. Overall agricultural product prices rose 2.2 percent on the month. Many analysts view WPI cautiously, given the high weighting of oil products in the index, and say the Producer Price Index, due out next week, gives a better picture of the German inflation situation.
France - January seasonally adjusted merchandise trade balance was 294 million euros, the first surplus in seven months as imports sank 6.9 percent, posting their biggest drop in more than 11 years. Seasonally adjusted exports fell 5.1 percent with all sectors posting declines except capital goods and autos. Exports to North America plunged nearly 17 percent from December's record high. For the full year 2000, the unadjusted trade surplus plummeted to E1.632 billion from E16.417 billion in 1999, as imports were boosted by higher oil prices and robust domestic demand, while slacker foreign demand undercut export growth.
Fourth quarter revised nonfarm private sector jobs rose 3.6 percent when compared with last year. Most of the fourth quarter gains came from the services sector, but construction and industry contributed a growing share as well. Services sector jobs rose 1.1 percent and 4.2 percent when compared with last year while the construction sector jobs rose 1.5 percent and a yearly gain of 5.2 percent when compared with last year.
Italy - January seasonally and workday adjusted industrial production fell 1.8 percent. However, the unadjusted industrial production, which takes no account of working days, was up 9.6 percent when compared with last year. The workday adjusted result shows an in increase of 1.9 percent. (January 2001 had 2 more working days than January 2000.) Seasonally adjusted consumer goods output dropped 1.9 percent and investment goods fell 3.1 percent on the month.
Britain - February seasonally adjusted producer input prices jumped 1.8 percent and 6.1 percent when compared with last year. The increase in the input price index mainly reflected a rise in crude oil prices, up 9.6 percent on the month and 8.5 percent on the year. Imported materials and crude oil account for around 69 percent of the overall input index. Not seasonally adjusted output prices slipped 0.1 percent but rose 1.8 percent when compared with last year. The fall in output prices was mainly caused by a drop in petroleum products prices. Seasonally adjusted core output prices were unchanged on the month and rose 0.5 percent on the year.
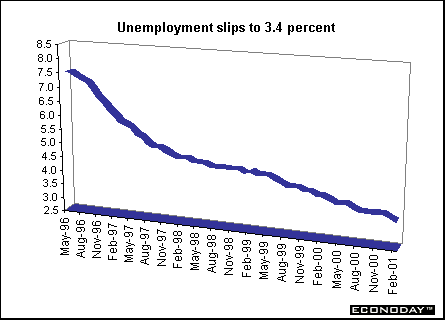
February claimant count unemployment rate slipped to 3.4 percent, the lowest rate since September 1975. Unemployment on the International Labor Organization measure in the three months to January fell 81,000 on the previous three month period and was down 209,000 on the year. The ILO unemployment rate fell to 5.2 percent from 5.3 percent in the previous three months. Employment growth picked up strongly rising by 102,000 in the three months to January. The participation rate increased to 74.8 percent from 74.6 percent in the previous three months.
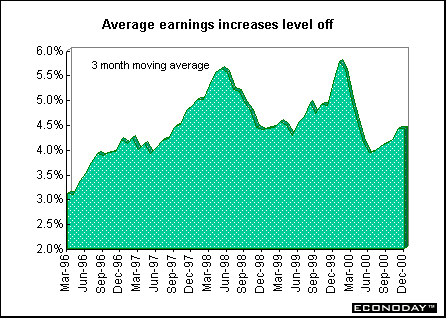
Average earnings growth in the three months to January remained stable at 4.4 percent when compared with last year as the base effect of millennium bonus payments a year earlier depressed the pay growth comparison. The headline figure had been depressed due to the size of bonus and overtime payments made in January last year. For the month of December alone, earnings growth rose 3.9 percent when compared with last year, a considerable drop from 4.8 percent in December. This reflects the influence of the base effect from last year.
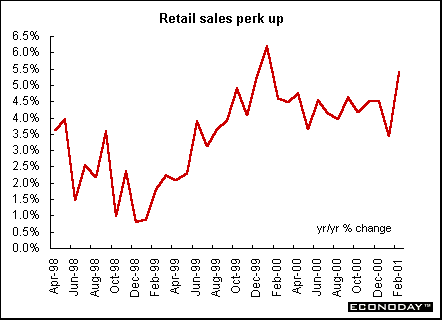
February retail sales volumes jumped 0.6 percent and 5.8 percent when compared with last year. In the three months to February, sales rose 1.6 percent on the previous three months and were up 4.6 percent on the year earlier period. The quarterly growth rate was the strongest since February 1998. The household goods sector jumped 1.9 percent while sales at food stores were up 1.1 percent.
Asia
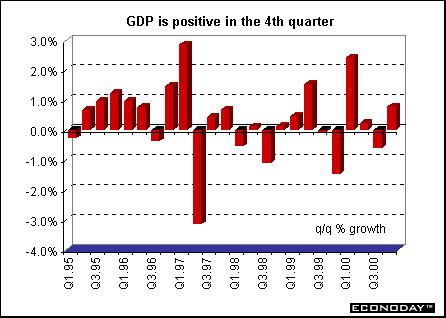
Japan - Fourth quarter seasonally adjusted gross domestic product rose 0.8 percent and at an annual rate of 3.2 percent. Business investment fueled the return to growth after a drop in the third quarter. Capital spending, which accounts for about 15 percent of the economy, rose 6.8 percent in the fourth quarter from the third quarter, the biggest increase in almost 11 years. Housing investment rose 4.4 percent and public consumption chipped in with a 0.9 percent increase. Net exports - exports minus imports - subtracted 0.3 percentage points from growth last quarter. Exports rose 0.6 percent, while imports rose 4.5 percent. Consumer spending, which makes up about 60 percent of the economy, fell 0.6 percent in the fourth quarter. While real GDP grew 0.8 percent in the fourth quarter, nominal GDP rose just 0.2 percent. The GDP deflator fell 1.7 percent from a year earlier, and has fallen from year-ago levels for 11 quarters.
January current account surplus sank 59.7 percent from a year earlier. The surplus in the current account, which is the broadest measure of Japan's trade with the rest of the world, stood at 249.6 billion yen ($2.08 million) in January before seasonal adjustment, compared with 619.2 yen the year earlier. The sharp drop reflects a slowdown in exports during January. Japan registered its first trade deficit in four years during the month as export growth to Asia and the United States dropped off in the wake of the U.S. economic slowdown. The biggest factor weighing on the current account was the trade balance, which shrank 89.9 percent from the previous year as exports only managed to eke out a 2.9 percent gain while imports jumped 24.8 percent. After adjustment for seasonal factors, the current account surplus in January was 2.8 percent higher in than the previous month. The trade and services surplus plummeted 71.6 percent on a seasonally adjusted basis.
January seasonally adjusted factory usage fell 2 percent, led by transportation and machinery, as waning overseas demand prompted companies to cut production. When compared with last year, factory usage fell 0.2 percent, while capacity dropped 0.9 percent, the 24th straight decline.
January revised industrial production fell 4.2 percent, more than the initial estimate of a 3.9 percent decline. Carmakers and manufacturers of computer parts accounted for most of the decline. January shipments fell 3.7 percent while inventories rose 0.4 percent. The inventory ratio, which measures inventories as a proportion of shipments, rose 2.2 percent.
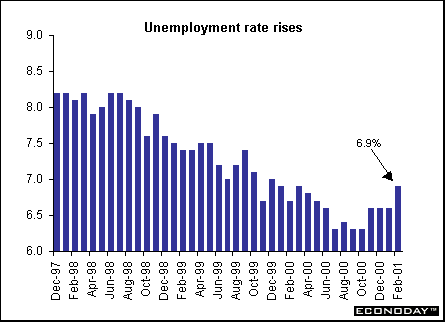
Australia - February unemployment rate jumped to 6.9 percent, the highest since December 1999 from 6.6 percent in January as more people looked for work. This is despite the largest rise in full time jobs in eight months. A corresponding fall in part time positions saw the economy add 2,500 new jobs overall.


Introduction • Global Stock Market Indexes • Recap of Global Markets • Currencies • Indicator Scoreboard

The Bottom Line • Looking Ahead
|