
Indicator scoreboard
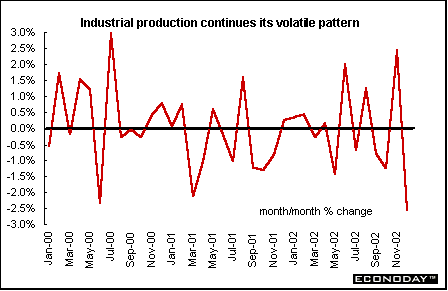
Germany - December seasonally adjusted industrial production fell 2.6 percent and 0.5 percent when compared with last year. Production has been down three of the last four months. Most industrial output categories fell, led by a 5.8 percent contraction in construction that more than erased the 3.8 percent gain of the month before. Output in both east and west Germany fell - 0.9 percent and 2.8 percent, respectively. Excluding construction, industrial output fell 2.4 percent after a 2.3 percent increase in November.
January wholesale prices jumped 1.4 percent and 1.2 percent when compared with last year because of higher prices for seasonal foods and energy products. Excluding seasonal food, wholesale prices rose 1.1 percent and 1.8 percent on the year. Energy prices rose 5.8 percent and were up 10.5 percent on the year. Excluding oil products, wholesale prices rose 0.7 percent but fell 0.2 percent on the year.
December seasonally adjusted merchandise trade surplus was €10.4 billion, down from November's €11.0 billion surplus and from €10.7 billion in December 2001. Exports were down 2.1 percent but up 2.8 percent on the year. Imports were down 1.3 percent but up 4.2 percent on the year.
France -December industrial production fell 1.7 percent but rose 0.5 percent when compared with last year. The monthly decline was the sharpest since November 1997. Production of cars and car parts fell 2.5 percent, and output of health care and beauty products dropped 6.3 percent from the previous month. Manufacturing output fell 1.8 percent but rose 1.6 percent on the year. Excluding food and energy, manufacturing output fell 1.8 percent and was up 1.1 percent on the year in December.
December seasonally adjusted merchandise trade surplus soared to €1.416 billion due to a sharp drop in imports. The November surplus was €249 million. Imports plunged 5.2 percent as imports of aircraft, lower semi-finished goods and pharmaceuticals declined. Machine tools and electronics imports remained depressed. Imports from the U.S. and especially other EU countries were hit hardest. Exports declined 0.8 percent, continuing the slide since August, despite the sale of an ocean liner and a record 22 Airbus planes. Semi-finished goods, pharmaceuticals and electrical equipment exports fell.
Italy - December seasonally and workday adjusted industrial production fell 0.6 percent after rising 0.8 percent in November. When compared with last year, industrial production fell 1.8 percent. Over the whole of 2002, Italian workday adjusted industrial output was down 2.3 percent compared with the previous year. Most product sectors declined.
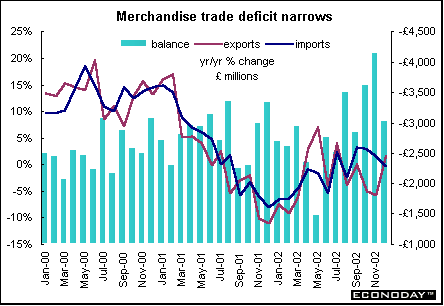
Britain - December global merchandise goods trade deficit narrowed to Stg3.012 billion from Stg4.12 billion previously. The value of exports rose 3.7 percent while imports declined 3.2 percent. The value of total exports including services rose 3.1 percent while imports declined 1.4 percent. The non-EU deficit shrunk to Stg1.87 billion in December from Stg3.115 billion in the previous month, the lowest since September. The EU shortfall widened slightly to Stg1.025 billion from Stg1.014 billion. Some of the latest improvement in the global goods trade gap was due to an improved position on both the oil and erratics accounts. Excluding these items, the deficit narrowed less sharply to Stg3.338 billion from Stg3.03 billion.
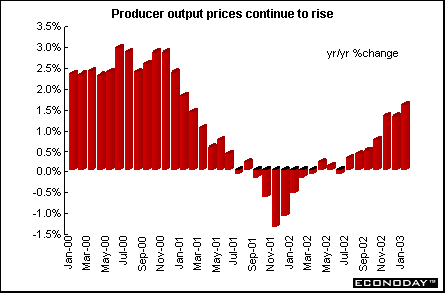
January seasonally adjusted output prices rose 0.4 percent and 1.6 percent when compared with last year, their fastest pace in two years. Output prices were pushed higher by higher petroleum product prices. Core output prices, which exclude food, beverages, tobacco and petroleum, rose 0.2 percent on the month and were up 1.0 percent on the year. Input prices rose 0.8 percent and 3.6 percent on the year. Crude oil prices exerted the biggest upward pressure on input prices, rising 6.5 percent on the month in January and 41.0 percent on the year.
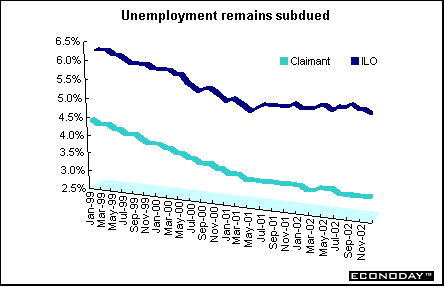
January claimant unemployment rate remained at 3.1 percent, which is the lowest since mid-1975. Manufacturing jobs in the three months through December fell by 148,000 from the year-earlier period to 3.57 million, the lowest since records began in 1985. In the three months to December, the official measure of unemployment formerly known as the International Labor Organization measure, fell to 5.1 percent from 5.2 percent in the three months to November.
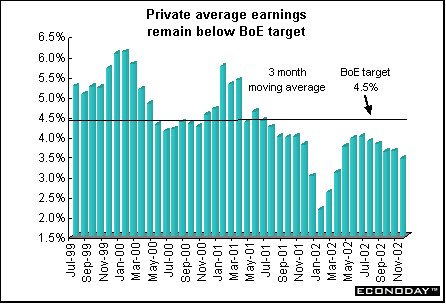
In the three months through December, average earnings rose by 3.7 percent when compared with the same period a year ago. That compares with a rate of 3.8 percent in the three months through November. Private-sector pay rose by 3.2 percent, down from 3.7 percent in the previous month. Average earnings excluding bonuses eased to 4.0 percent from 4.4 percent the previous month.
Asia
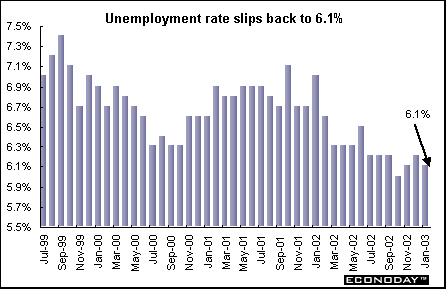
Australia - January seasonally adjusted employment rose by 111,000 jobs - the most in 11 1/2 years. The jobless rate fell to 6.1 percent from 6.2 percent in December. The economy added 72,400 full-time jobs in January, after a gain of 49,500 in December. Part-time employment rose by 38,600 jobs following a 2,500 gain in December. The total monthly employment gain was the highest since a record 124,500 jobs were added in August 1991. Almost 9.5 million of Australia's 20 million people now have a job, the most on record. The participation rate, which measures the proportion of people with jobs or looking for work, rose to a record 64.7 percent from 64.2 percent in December.
Japan - December seasonally adjusted current account surplus narrowed to ¥86.7 billion ($8.2 billion) from ¥1 trillion yen in November. Exports fell 4.7 percent from a month earlier on a current account basis, snapping a three-month gain. The current account is the broadest measure of trade because it includes investment and services. From a year earlier, the surplus narrowed 1.4 percent. The expansion of the services deficit was mainly due to more overseas travel, while the fall in the income surplus contributed to the overall current account shrinkage.
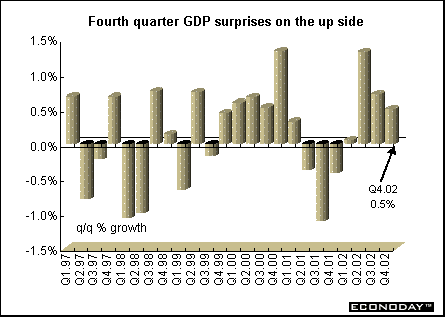
Fourth quarter seasonally adjusted gross domestic product rose 0.5 percent from the third quarter. Most analysts had expected it to decline. When compared with a year ago, GDP grew 2.4 percent. Exports expanded by 4.5 percent in the fourth quarter from the third, picking up speed from growth of 0.1 percent in July through September. Business spending climbed 1 percent, and consumer spending rose 0.1 percent. Consumer spending, which accounts for 55 percent of GDP, rose 0.1 percent in the three months to December, marking the fifth straight rise despite shrinking incomes and record unemployment. The data underscored the price declines that continue to plague the economy. The GDP deflator, a measure of inflationary or deflationary pressure, was minus 2.2 percent in the October-though-December period, worse than minus 1.9 percent in the previous quarter. Technical factors amplified deflation's impact on GDP in the quarter. The government switched its measure of prices changes from the wholesale price index to the corporate goods price index, or CGPI, which gives more weight to cell phones, computers and other IT goods whose prices have fallen dramatically. Ironically, price declines helped Japan post real GDP growth.
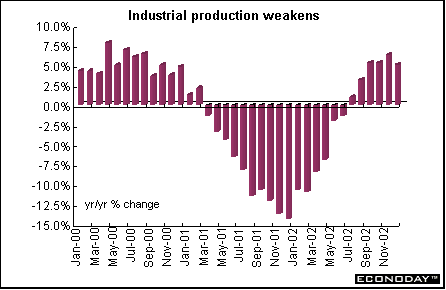
December revised industrial production decreased 0.4 percent compared with the 0.1 percent decrease originally reported. The downward revision indicates Japanese manufacturers are slowing production as exports slow amid sluggish global economic growth. The downgrade will also likely fuel worries that the weak global economy may weigh further on industrial production, which has been the driving force behind Japan's modest economic recovery.


Last Week's Highlights • Global
Stock Market Indexes • Recap of Global Markets
• Currencies • Indicator
Scoreboard

The Bottom Line •
Looking Ahead
|