
Indicator scoreboard
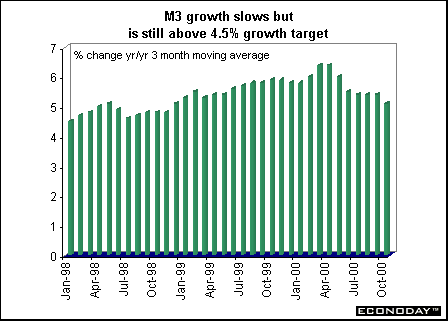
EMU - November M3 money supply growth rate slowed sharply to 4.9 percent when compared with last year. The three month moving average of 12 month rates (September to November) fell to 5.1 percent, moving closer to the ECB's 4.5 percent reference value. Credit extended to the private sector slowed to an increase of 10.1 percent in November from 10.8 percent in October. Money supply growth has exceeded the ECB's target of 4.5 percent in every month since the euro's introduction at the start of 1999, and reached a high of 6.5 percent in April.
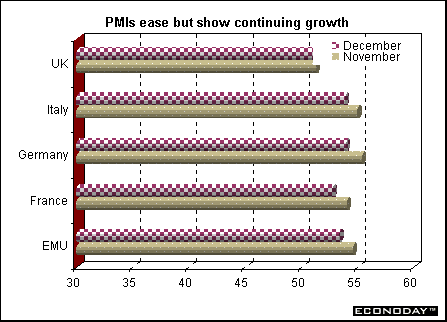
December seasonally adjusted Reuters purchasing managers' index fell to 53.4. This was the eighth month in a row that the index has declined, hitting its lowest level since June 1999 and indicating that the pace of manufacturing sector growth continues to slow. The activity index has declined every month since reaching a peak of 60.7 in April. An index level above 50 indicates the manufacturing sector is expanding, while a level below 50 indicates contraction. The higher the index above 50, the stronger sector growth. The prices index, which is not part of the overall PMI, fell to 61.3 in December from 66.7 in November. The latest figure was the lowest reading since August 1999 and the third straight monthly decline. The EMU PMI is based on results from Germany, France, Italy, Spain, Ireland and Austria.
December Reuters seasonally adjusted services activity index fell to 56.2 from 56.4 in November. This is the lowest index level since May 1999. After its peak of 62.2 in April of this year, the services activity index has fallen in seven of the following eight months.
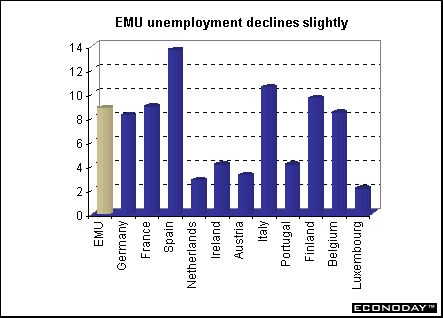
November seasonally adjusted unemployment rate remained unchanged at 8.8 percent. Of the nine countries reporting data, unemployment fell in three while it remained unchanged in six.
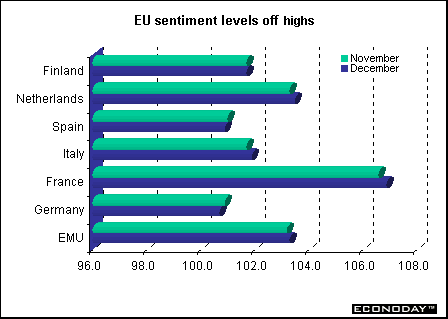
December European Commission's economic sentiment index recovered slightly, rising for the first time since July 2000. The overall index stood at 103.3, up from 103.2 in November. The rise was entirely due to an improvement in consumer sentiment, while industrial sentiment remained unchanged.
October merchandise trade surplus with the rest of the world was E3.7 billion, slightly more than half the surplus of E7.0 billion in October 1999. The September trade balance was revised down significantly to a deficit of E0.4 billion from an initially reported surplus of E3.3 billion. That compared with a surplus of E1.3 billion in September 1999. In the first 10 months of 2000, the EMU recorded a cumulative trade surplus of E11.3 billion, significantly less than the E44.7 billion trade surplus seen in the same period of 1999.
Germany - November seasonally adjusted manufacturing orders dropped 0.9 percent. The decline was due to a big drop in foreign orders (-2.5 percent) outpacing a slight rise (0.3 percent) in domestic orders. Manufacturing orders fell across the board, with the exception of gains in domestic orders for basic goods and durable/consumer goods. Orders fell 0.8 percent in west Germany while in the east, they plummeted 1.7 percent.
France - November seasonally adjusted unemployment rate fell to 9.2 percent, according to the International Labor Organization definition, which excludes job seekers who did any work during the month. The unemployment rate is the lowest since April 1991.
November producer price index slipped 0.1 percent due largely to lower energy prices but rose 5.9 percent when compared with last year. Energy prices fell 0.8 percent, the first decline in 18 months, for a gain of 24.0 percent on the year. Excluding energy and food, the core PPI increase slowed to 0.1 percent and 2.5 percent when compared with last year.
Italy - October seasonally adjusted unemployment rate fell to 10.0 percent from 10.5 percent in July. The employment surveys are carried out every three months (January, April, July and October). Jobs were created in all sectors and regions, especially in the services industry and in the northeast.
November producer prices rose 0.4 percent and 6.7 percent when compared with last year due to higher electricity and natural gas tariffs. Excluding energy and water, producer prices increased 0.1 percent and 2.8 percent when compared with last year.
Britain - December Nationwide building society average house price index rose 1.2 percent, the fastest pace since April. Prices increased 9.3 percent when compared with last year.
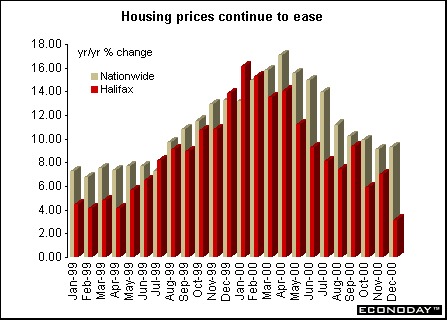
December Halifax house price index fell 1.1 percent but was 3.1 percent higher than a year ago. The 1.1 percent decrease was the largest drop in six-and-a-half years. When compared with last year, the annual gain was the smallest since April 1996.
December seasonally adjusted service sector activity index rose to 57.6 from 57 in November. Any reading above 50 indicates expansion. This is the fastest rate of growth since August 2000.
Asia
Japan - September retail sales fell 0.7 percent when compared with last year while large stores retail sales fell 1.4 percent. Total sales were up 0.9 percent on the year while wholesale sales rose 1.4 percent. November seasonally adjusted department store and supermarket sales fell 0.5 percent after rising 2.2 percent in October, as falling prices and stiffer competition increased shoppers' reluctance to spend.
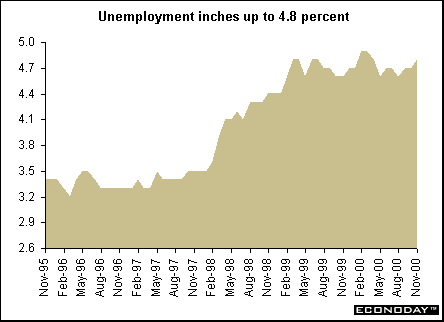
October unemployment rate rose to 4.8 percent from 4.7 percent in October.
November seasonally adjusted household spending fell 2.1 percent and 2.3 percent when compared with last year.
November seasonally adjusted industrial production fell 0.8 percent but rose 3.2 percent on the year. Shipments fell 0.3 percent on the month and rose 2.6 percent on the year while inventories fell 0.7 percent on the month and rose 1.2 percent on the year. The inventory ratio was down 1.8 percent on the year but rose 1.1 percent on the month.
Australia - November's merchandise trade balance posted a smaller-than expected deficit, falling just short of maintaining a surplus for a third month, as the weak Australian dollar lifted exports. The trade balance swung back to a A$45 million ($25 million) deficit. The September and October trade surpluses were helped by a surge in services exports associated with the September Sydney Olympic Games and the low Australian dollar. Exports fell 1.2 percent in November, led by coal. That was partly offset by a rise in the export of transport equipment and metals. Imports rose 0.8 percent, led by consumer goods, such as household electrical items.
Americas
Canada - November industrial product price index jumped 0.6 percent and 5.2 percent when compared with last year. More than half of the yearly increase was the result of a 36.6 percent annual increase in the price of petroleum and coal products. If petroleum and coal prices were excluded, the yearly advance would have been 3 percent. For November, petroleum and coal-product prices rose 2.3 percent.
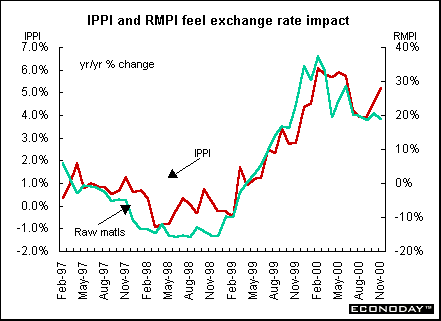
November raw materials prices soared 2.1 percent and surged 18.9 percent on the year, mostly due to higher crude-oil costs. Prices in the mineral fuels component of the index, which consists mostly of crude oil, rose 5.4 percent in November and jumped 45.3 percent on the year. If mineral fuels were excluded, the yearly increase would have been only 3.4 percent. For the month, the materials index would have declined 0.5 percent.
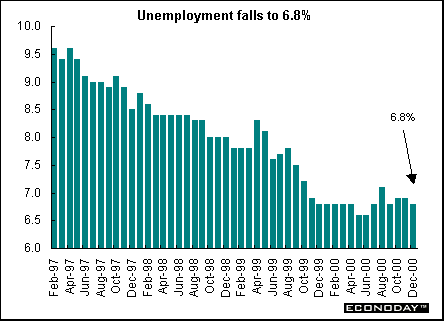
December unemployment rate slipped to 6.8 percent. Employment was up 31,100 jobs - the fifth consecutive monthly increase -- bringing growth for 2000 to 2.2 percent. Job growth was equally split between full and part time work, although 90 percent of the gains in the past five months have been in full time work. Manufacturing represented the largest growth in employment, up 29,000 in December. Manufacturing was up 2.9 percent or 65,000 workers in the last three months of the year.


Introduction • Global Stock Market Indexes • Recap of Global Markets • Currencies • Indicator Scoreboard

The Bottom Line • Looking Ahead
© Econoday, 2000. All Rights Reserved.
|