 |

Long Term Perspective
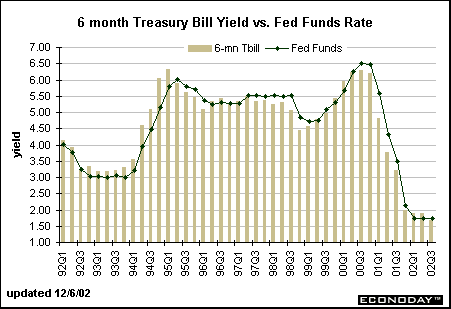
The spread between the 6-month Treasury bill and the federal funds rate is also negative. This means that the yield on the 6-month bill tends to be lower than the fed funds rate. In the 1980s, this spread averaged -15 basis points, but averaged zero basis points in the 1990s.

Short Term Perspective
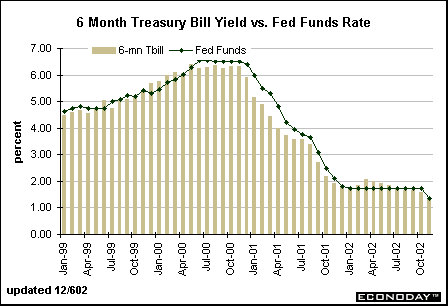
In 2000-01, the yield on the 6-month Treasury bill was 26 basis points below the federal funds rate, on average. Note that the 6-month yield was above the funds rate from 1999 through May 2000, but fell below the funds rate. This implies that market players were expecting the Fed to tighten in the first half of the year, but ease in the second half of 2000 and in 2001. In February 2002, the yield on the 6-month bill began to rise as market players anticipated that the Fed would soon raise rates. Investors now believe that the Fed won't raise rates for several months. This is putting a damper on 6-month bill yields.


About the Bond Market • Bond Market Charts • Treasury Market Charts • Treasury Auctions
|
 |